Can the mood of financial news predict tomorrow's dollar?
A team of four students used an LLM to score risk sentiment in 38,384 news articles about the US and the euro area. When US news turned more risk-averse than euro-area news by one point, the dollar fell by 8.1 basis points the next day on average, beyond what interest rates and the VIX explained. They also reported where the signal weakened.
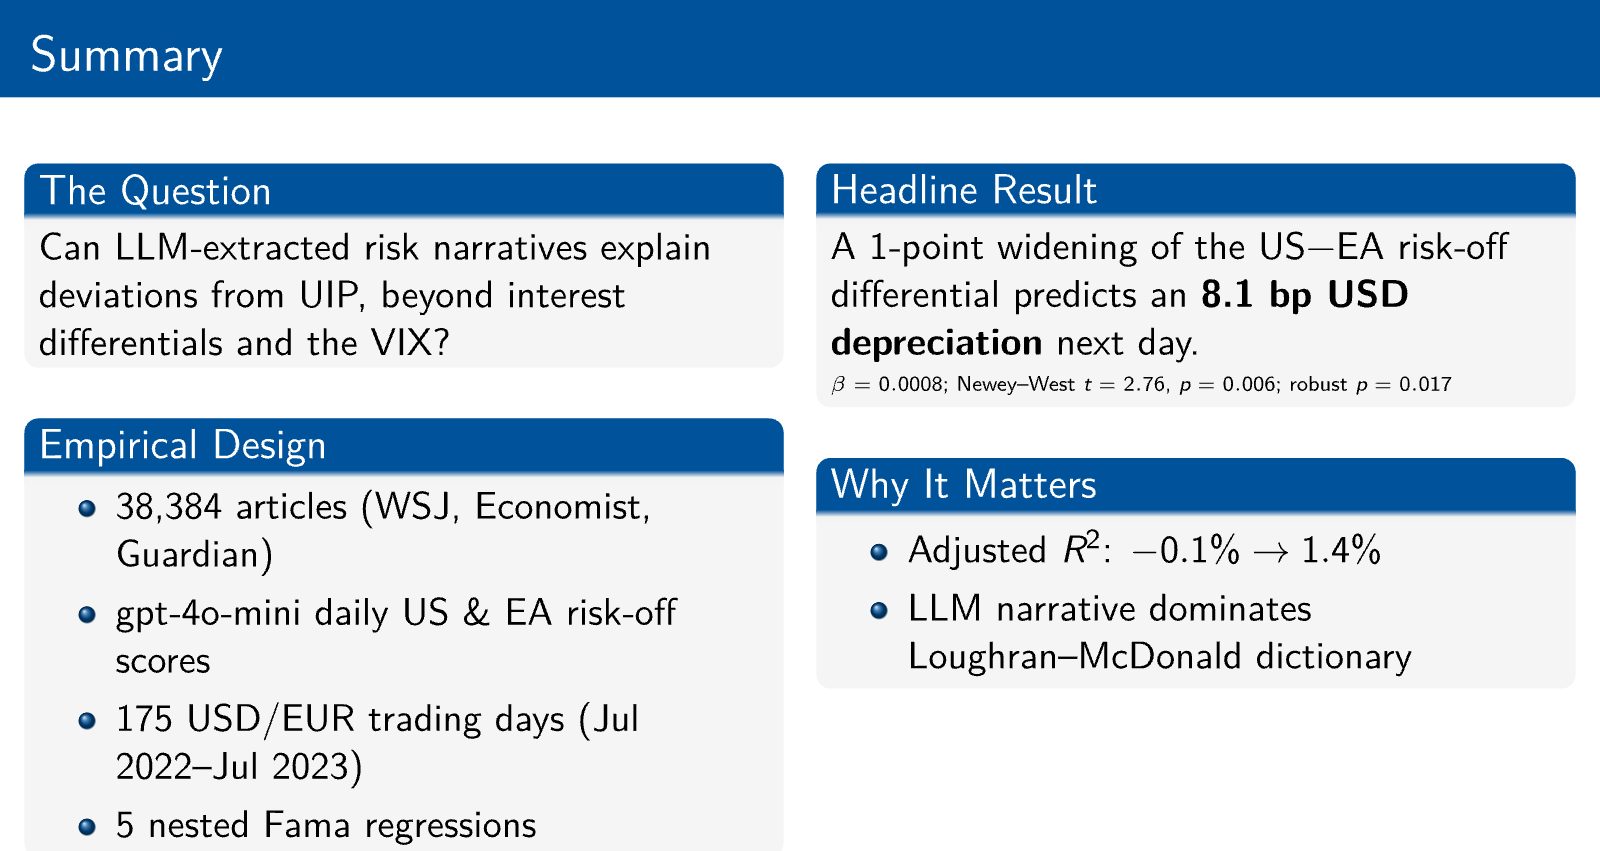
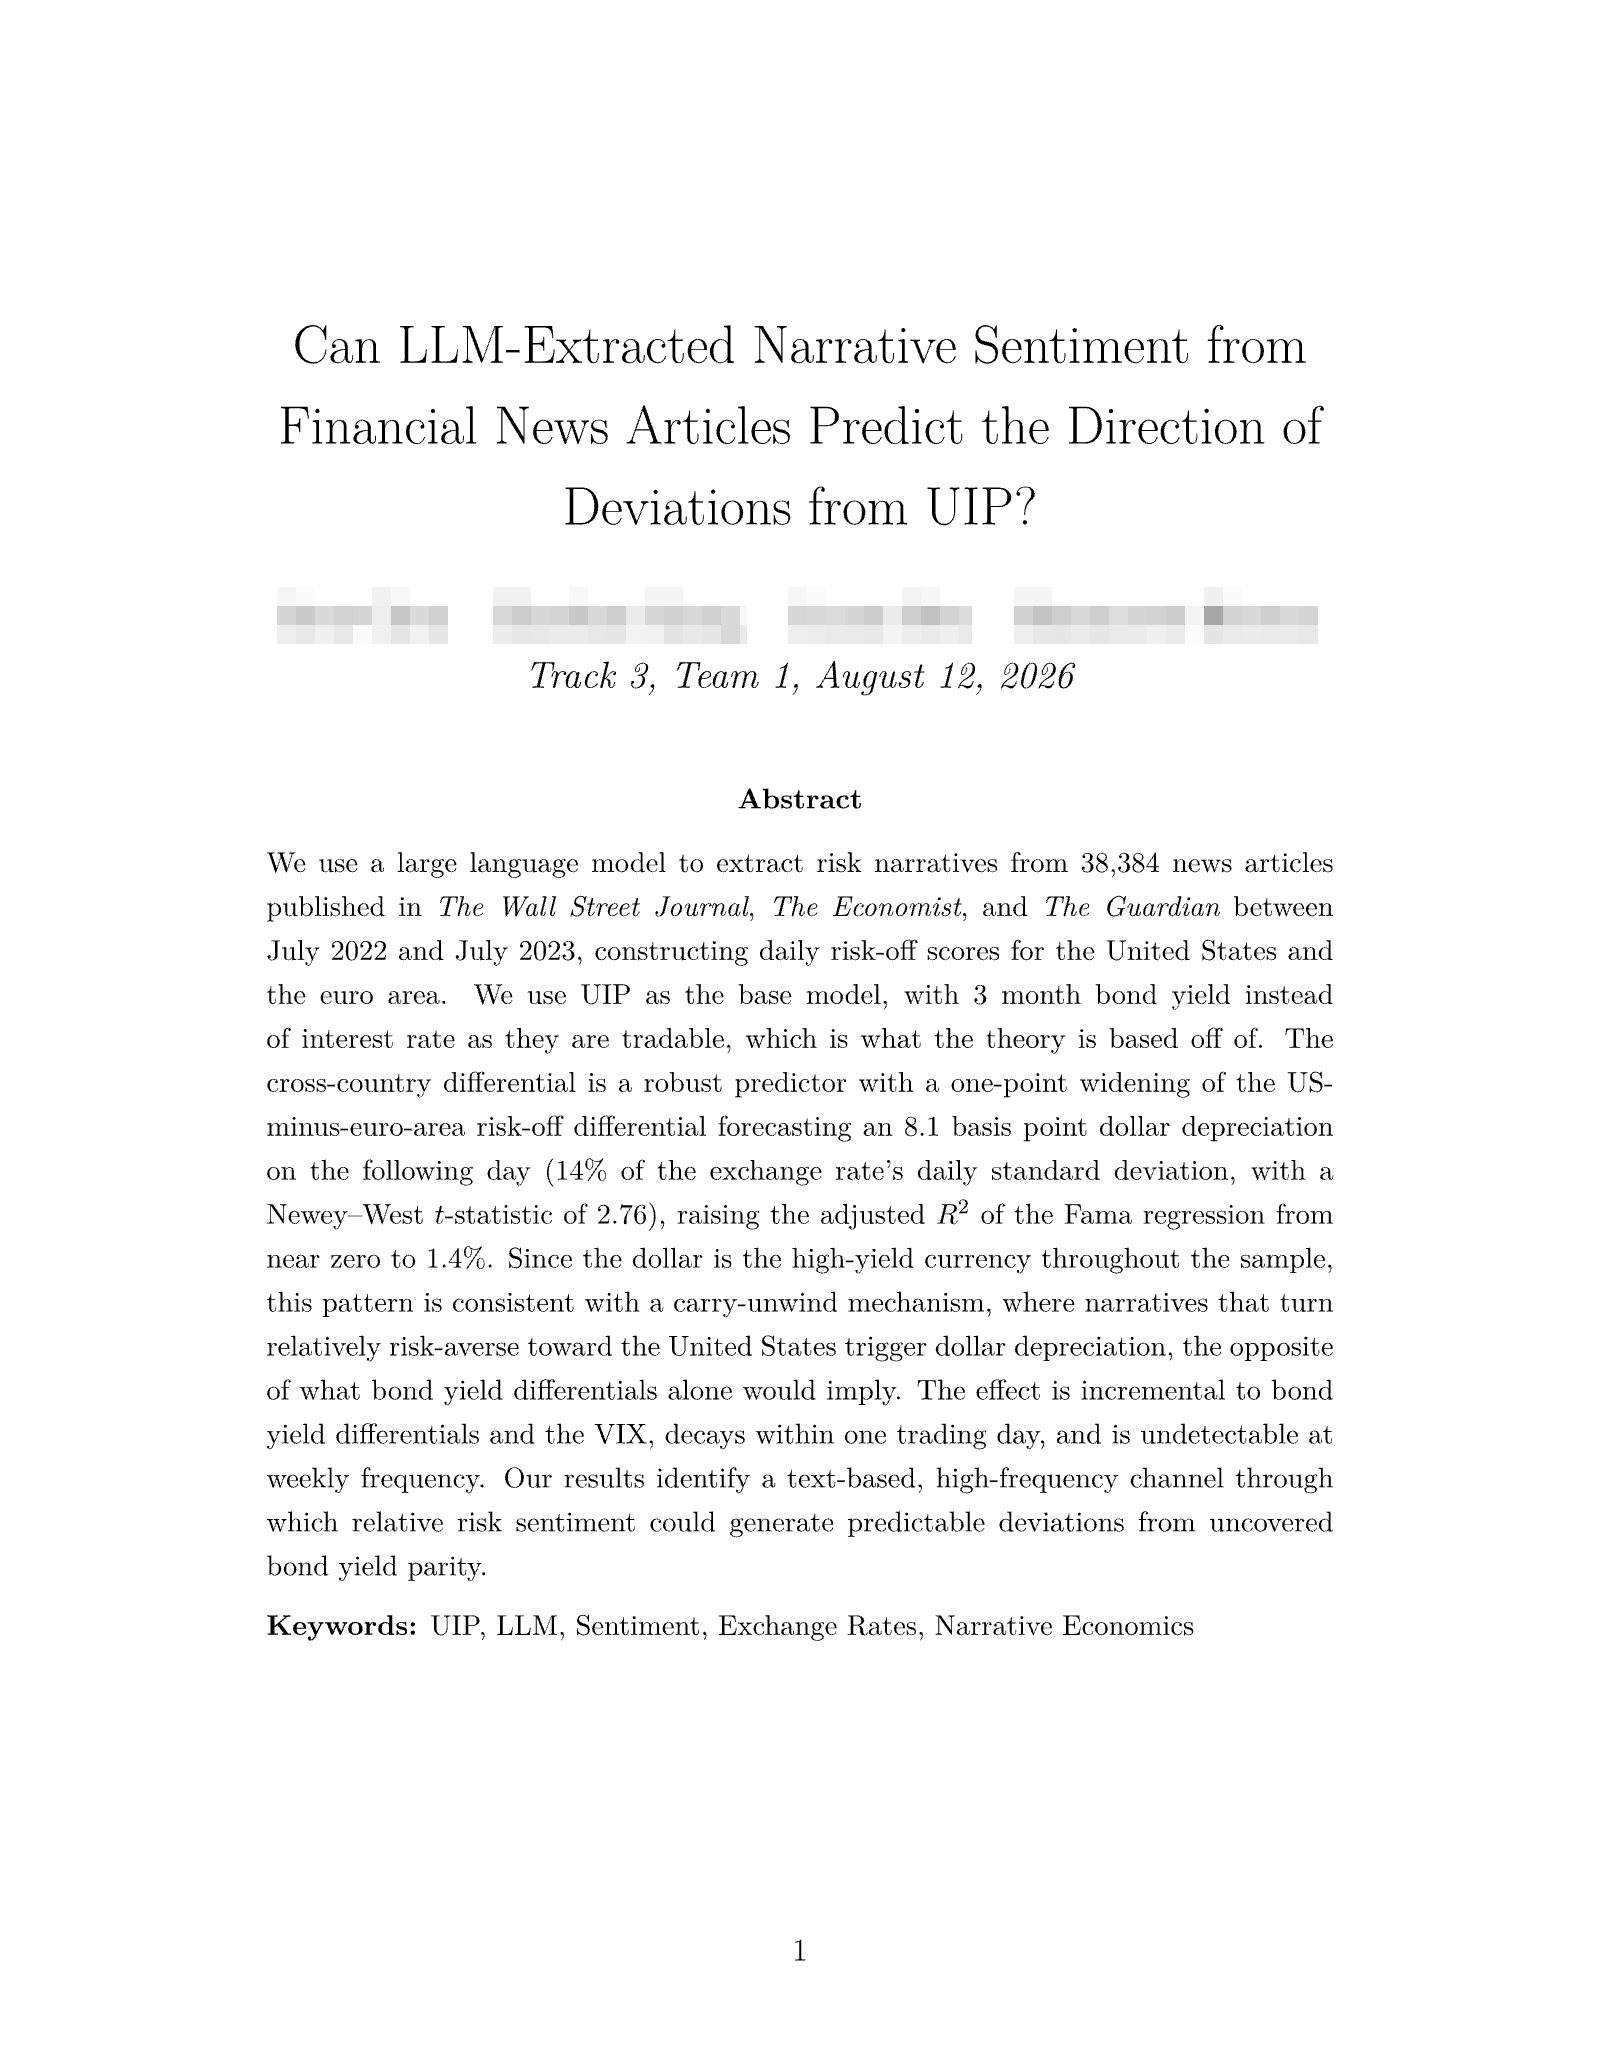
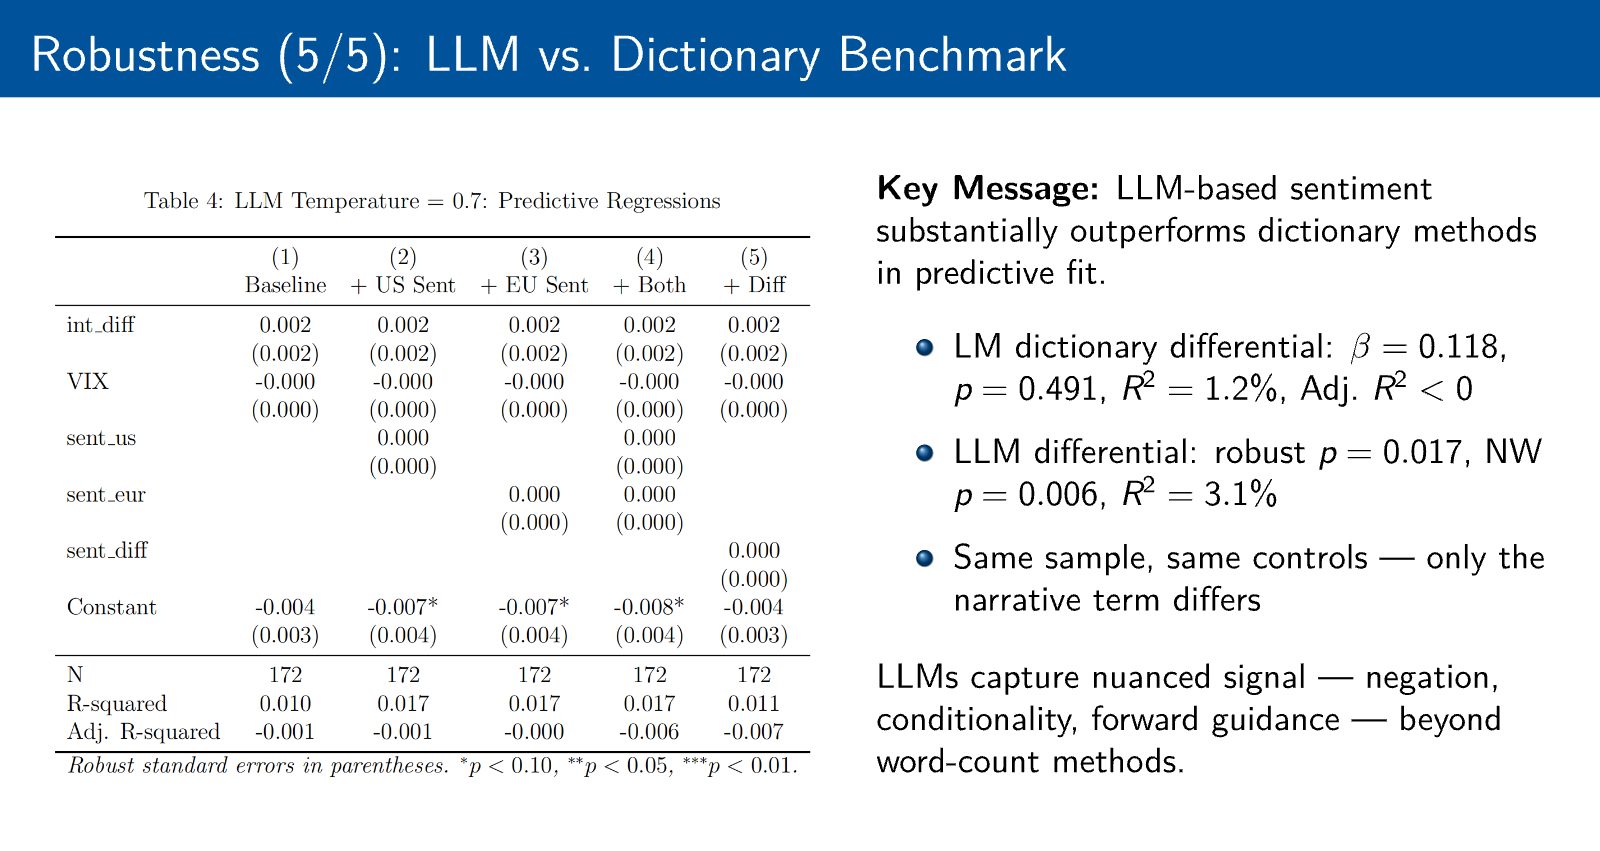
Uncovered interest parity (UIP) says high-yield currencies should weaken, yet they often strengthen, and standard risk measures only partly explain why. This team used gpt-4o-mini to score risk-off sentiment in 38,384 articles from The Wall Street Journal, The Economist and The Guardian, July 2022 to July 2023, and built daily scores for the United States and the euro area. Across five nested regressions on 175 USD/EUR trading days, neither country's sentiment level predicted the next-day exchange rate, but the gap between them did: a one-point widening of the US-minus-euro-area gap predicted an 8.1 basis-point dollar depreciation the next day (Newey–West t = 2.76), and raised adjusted R² from −0.1% to 1.4%. The LLM measure outperformed a standard finance dictionary on the same sample. The signal held on a longer 2022–2024 sample but disappeared when the LLM ran at temperature 0.7.
Keywords · uncovered interest parity · LLM sentiment · exchange rates · financial news · Fama regression · robustness
Who did this work
- Concentration focus
- AI + Business & Finance
- Concentration focus
- AI + Business & Finance
- Concentration focus
- AI + Business & Finance
- Concentration focus
- AI + Business & Finance
Students are not named. Year of study is as of fall 2026. Direction and goal come from each student's own program plan.
1An old currency puzzle and a new way to read the news
Textbook theory says a currency with higher interest rates should weaken over time. In practice it often strengthens, a pattern economists call the UIP puzzle [1]. One explanation is risk: when investors get nervous, they pull out of trades that bet on that gap.
Measures like the VIX capture some of that mood, but news carries more. Word-count dictionaries miss negation and conditional language [2]. The team asked whether an LLM reading the news could pick up a risk signal that interest rates and the VIX had not already priced in.
2Same sample, same controls, one new term at a time
- Collected the news. 38,384 articles from The Wall Street Journal, The Economist and The Guardian, July 2022 to July 2023.
- Scored risk-off sentiment. Asked gpt-4o-mini to rate each article's risk-off intensity and its market-wide impact on 0–10 scales, at temperature 0, then built daily scores for the US and the euro area.
- Ran five nested regressions. Started from the standard Fama regression with the interest differential and the VIX, then added the US level, the euro-area level, both, and finally only the US-minus-euro-area gap.
- Tested robustness five ways. Newey–West errors, lagged sentiment, a longer 2022–2024 sample, a standard finance dictionary on the same sample, and a higher LLM temperature.
3Only the gap between the two regions carried the signal
| Test | Result |
|---|---|
| US or euro-area sentiment level alone | No predictive power |
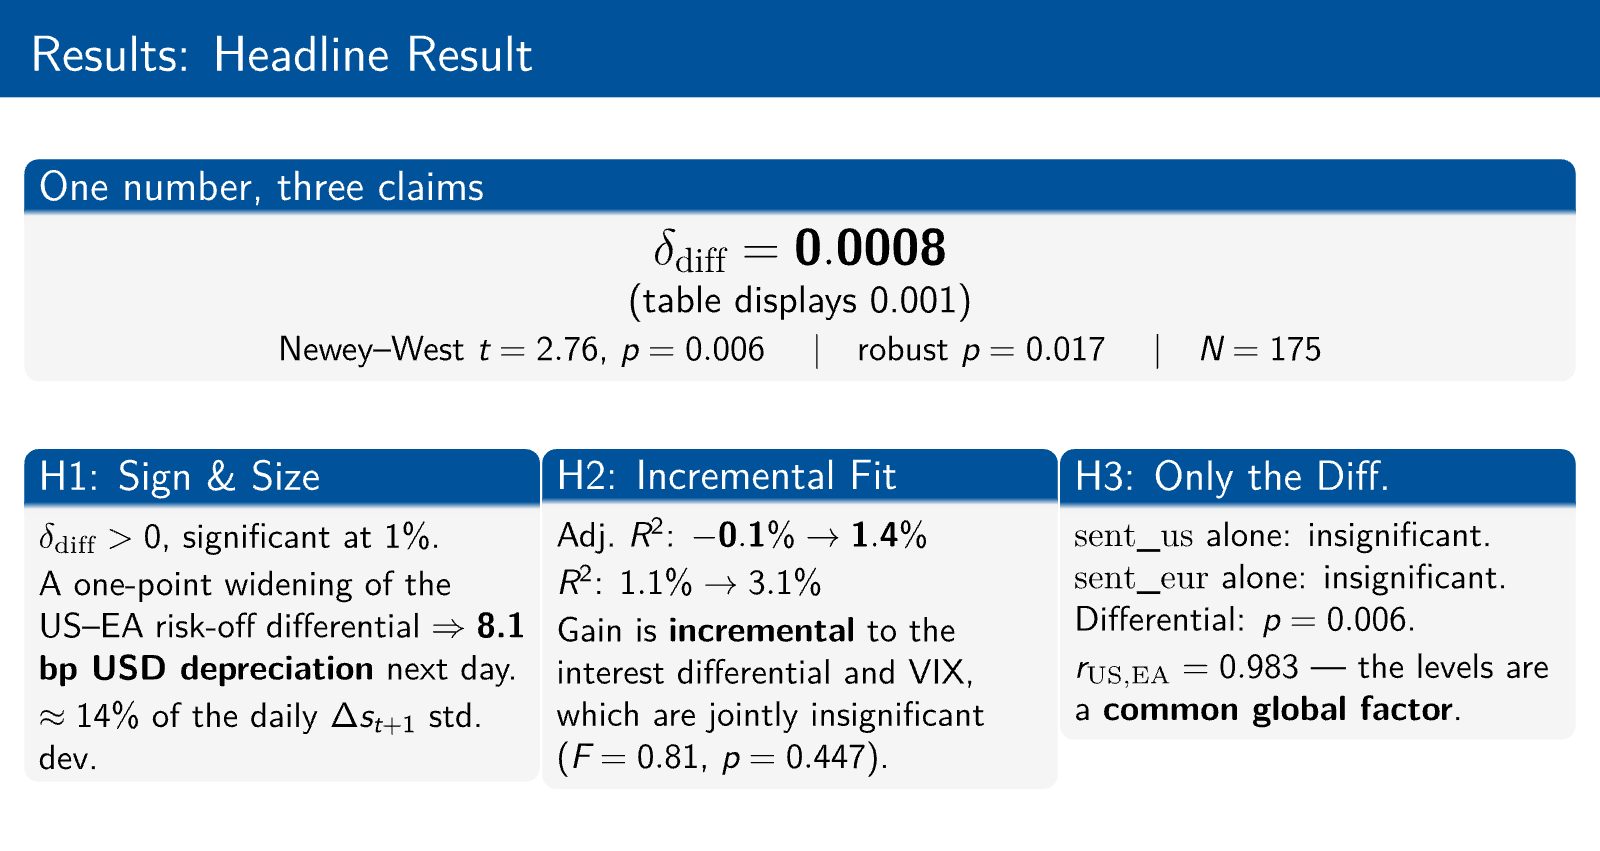
| US-minus-euro-area gap | 8.1 bp next-day dollar depreciation per point (Newey–West t = 2.76, p = 0.006) |
| Adjusted R² | −0.1% → 1.4% |
| Lagged sentiment | Not significant: the signal fades within a day |
| Finance dictionary (Loughran–McDonald) instead of the LLM | Not significant (p = 0.491) |
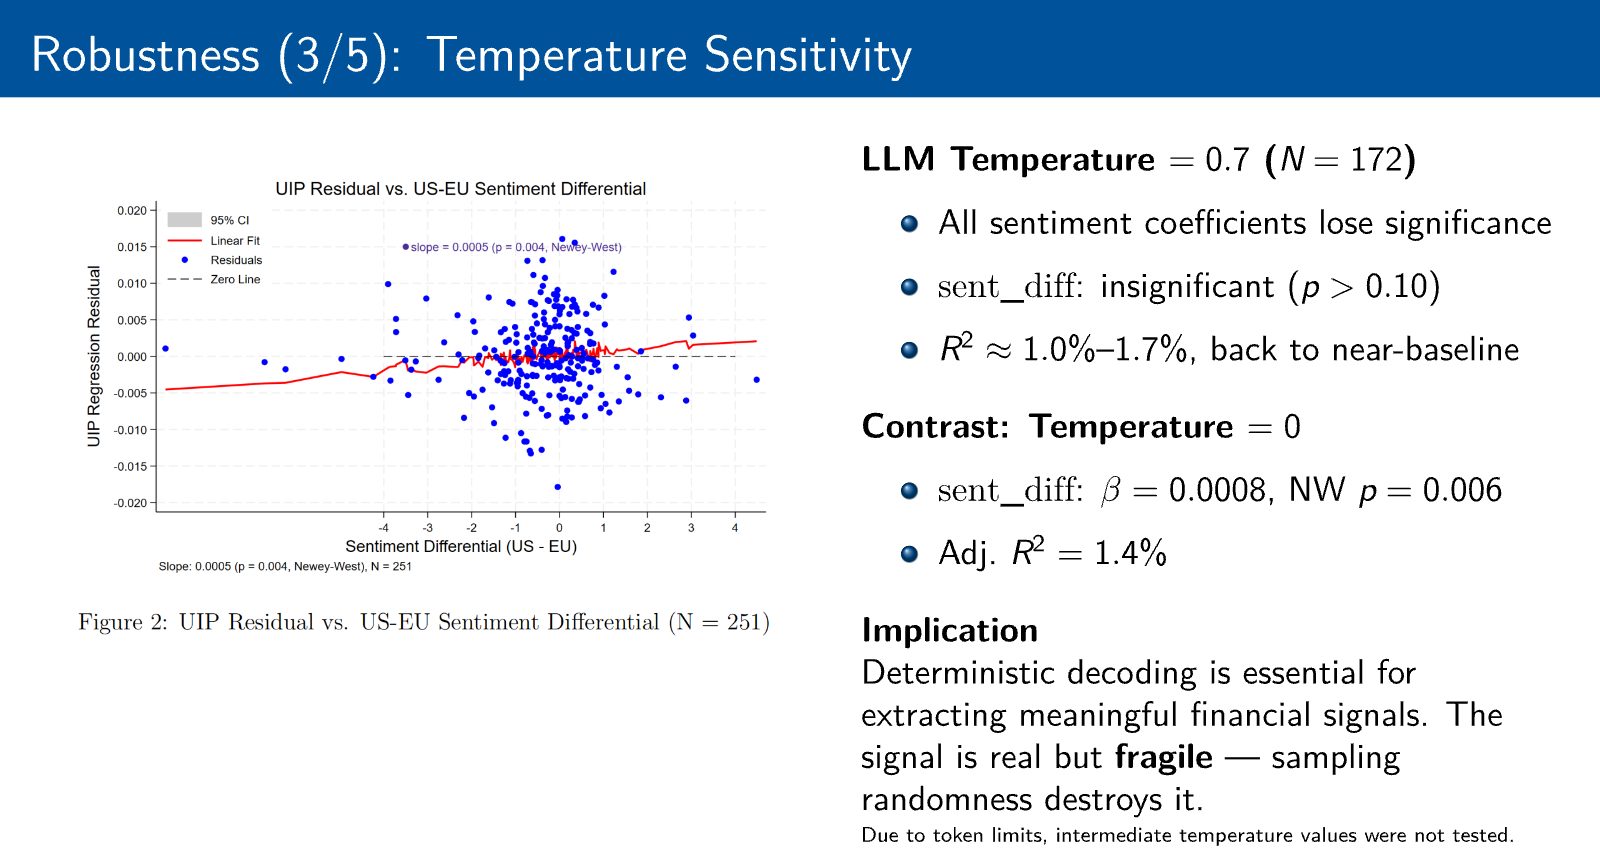
| Longer sample, 2022–2024 (251 days) | Smaller but still significant (Newey–West p = 0.004) |
| LLM at temperature 0.7 | Significance disappears |
The fit is small in absolute terms. The team pointed to Meese and Rogoff's finding that exchange rates are very hard to beat with any model [3], so a 1.5-point gain in adjusted R² is a meaningful increment, not a trading strategy.
4The paper and selected slides
Pages from the team's final paper and presentation. Student names are blurred or cropped out.
5What this does not show
- The main sample is 175 trading days of one currency pair, USD/EUR. Results may not carry over to emerging-market currencies.
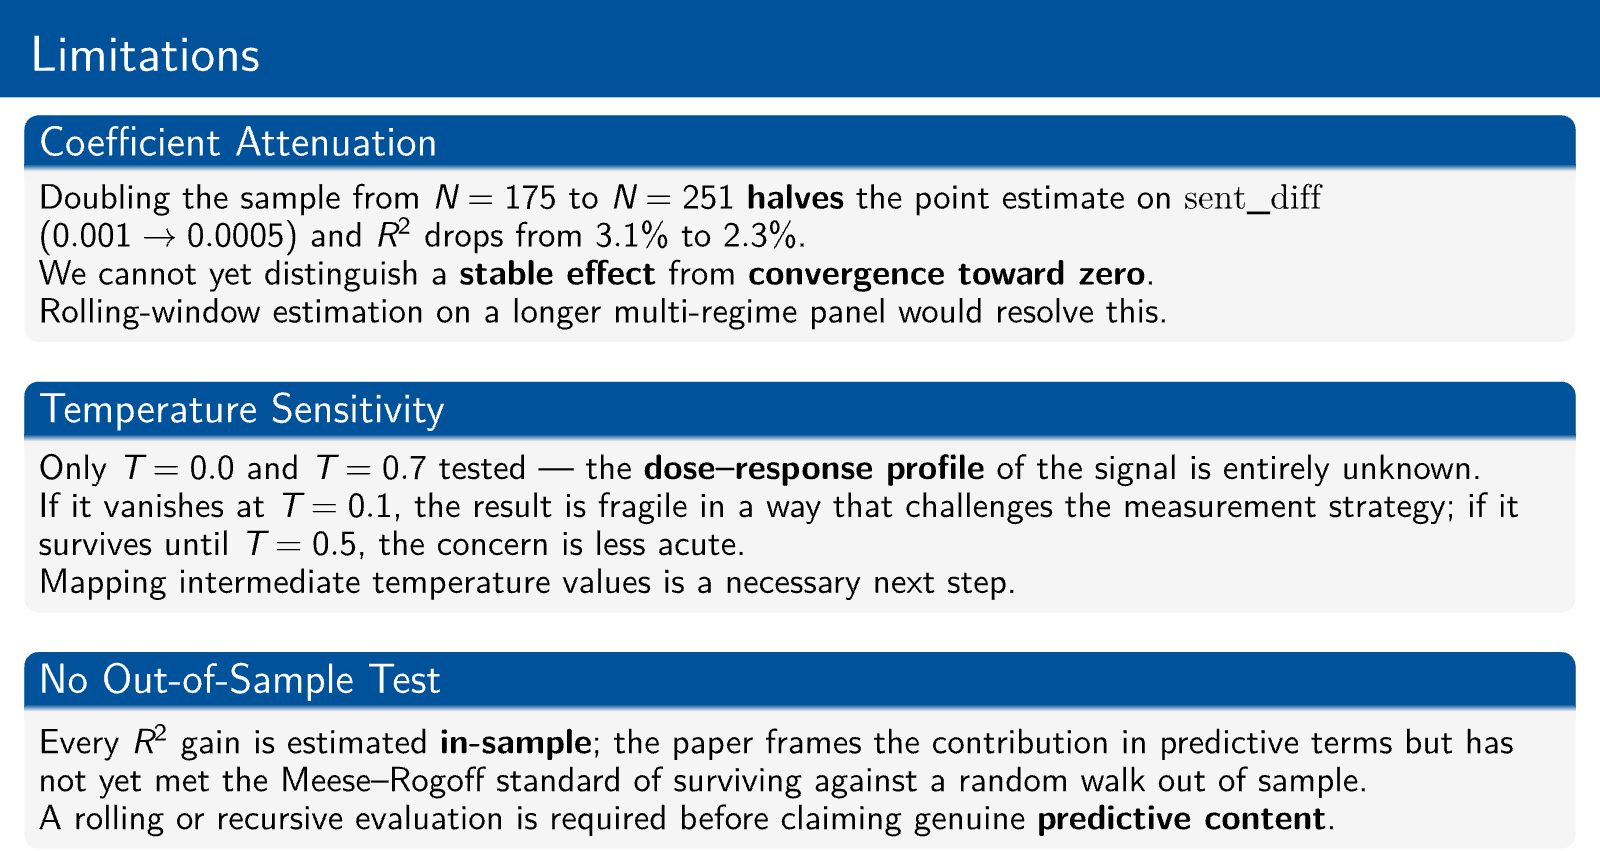
- Results are in-sample. The team did not run an out-of-sample forecasting test.
- On the longer sample the estimated effect shrank from 0.0008 to 0.0005, so its size is not yet stable.
- Only temperatures 0 and 0.7 were tested; the signal depends on deterministic scoring.
6What this work shows the team can do
Economist and Researcher in AI for Financial Systems
Research Scientist at the Stanford Digital Economy Lab. Seven years at the Federal Reserve Bank of Richmond. PhD in Economics.
The team designed the study, built the pipeline, ran the regressions and wrote the paper. The Project Lead reviewed the research design and gave feedback at each stage.
Economics · Finance · Applied AI
A research paper that tests a classic puzzle with a new measure, and reports its own weak spots, works well as a writing sample.
7What the Project Lead observed
After the project, the Project Lead wrote an evaluation of each student and placed each one on a four-level scale. This section shows the highest level reached on the team. The notes below describe the team's project. Individual ratings are not published.
System-Level Insight
- 1Foundational Application
- 2Applied Reasoning
- 3Independent Problem Solving
- 4System-Level Insight
Level 4 of 4: anticipates broader implications, risks or downstream effects, and connects technical decisions to real-world impact.
- Framing the problem
- Wrote the first full proposal and owned its revisions. Pushed the team to define the sentiment concept clearly and use it consistently, and proposed anchoring the score scale with written descriptions so scores stayed comparable.
- Decisions and trade-offs
- Kept ordinary least squares for interpretable coefficients and used a small neural network only as a robustness check. Repeatedly cut the scope to what the team could finish within token and time limits.
- Evidence and testing
- Ran the regressions and shared code and results as a replication package. Asked whether high collinearity between US and euro-area scores came from the pipeline or the data. When temperature 0.7 removed significance, redirected the robustness plan toward a longer sample at temperature 0 and added Newey–West checks.
- Limits and risk
- Wrote the generalizability limit into the proposal: results for USD/EUR may not hold for emerging-market currencies, where sovereign risk and capital controls can dominate.
Source: the Project Lead's written evaluations, August 2026.
References
- Fama, E. F. (1984). Forward and spot exchange rates. Journal of Monetary Economics, 14(3), 319–338.
- Loughran, T. & McDonald, B. (2011). When is a liability not a liability? Textual analysis, dictionaries, and 10-Ks. Journal of Finance, 66(1), 35–65.
- Meese, R. A. & Rogoff, K. (1983). Empirical exchange rate models of the seventies. Journal of International Economics, 14(1–2), 3–24.
Join the AI and Economics: Decision-Making with Language Models – Bloomberg Project
This outcome came out of this project. Work with an economist on a real question about markets and language models, and leave with research you can show.