4,407 knee MRIs, 58 labels. Fix the data before you train the model.
A team of four students worked with 4,407 knee MRI studies, only 58 labeled by radiologists. Before training anything, they found that two metadata columns were identical on every row, and they used LLMs to turn free-text reports into labels that scored 0.80–0.89 AUROC against the radiologists' labels.
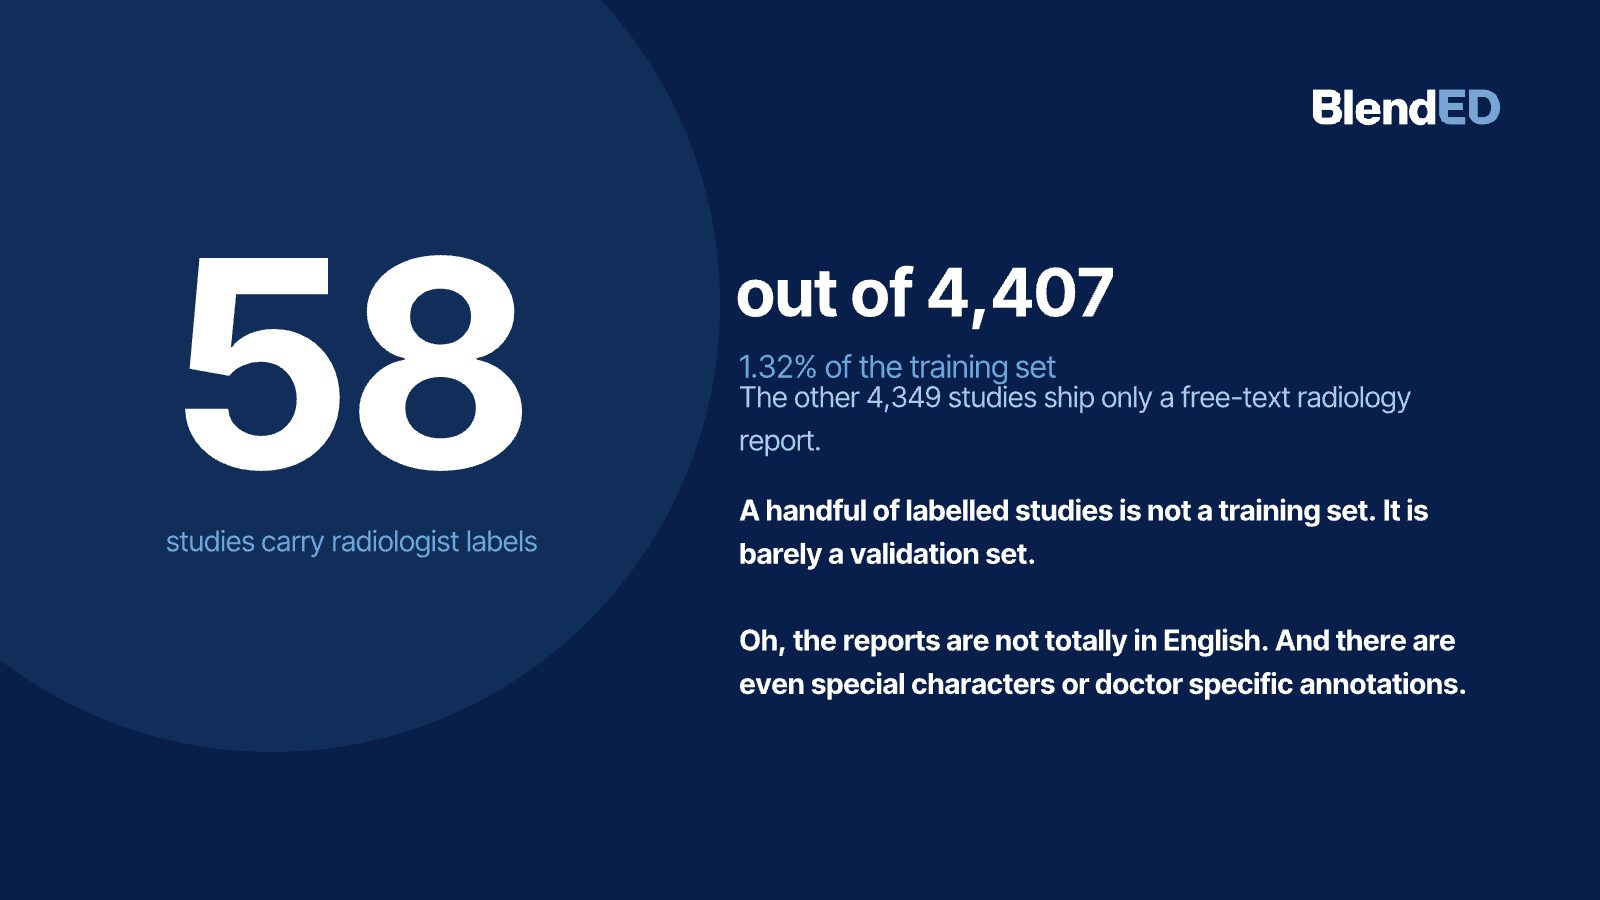
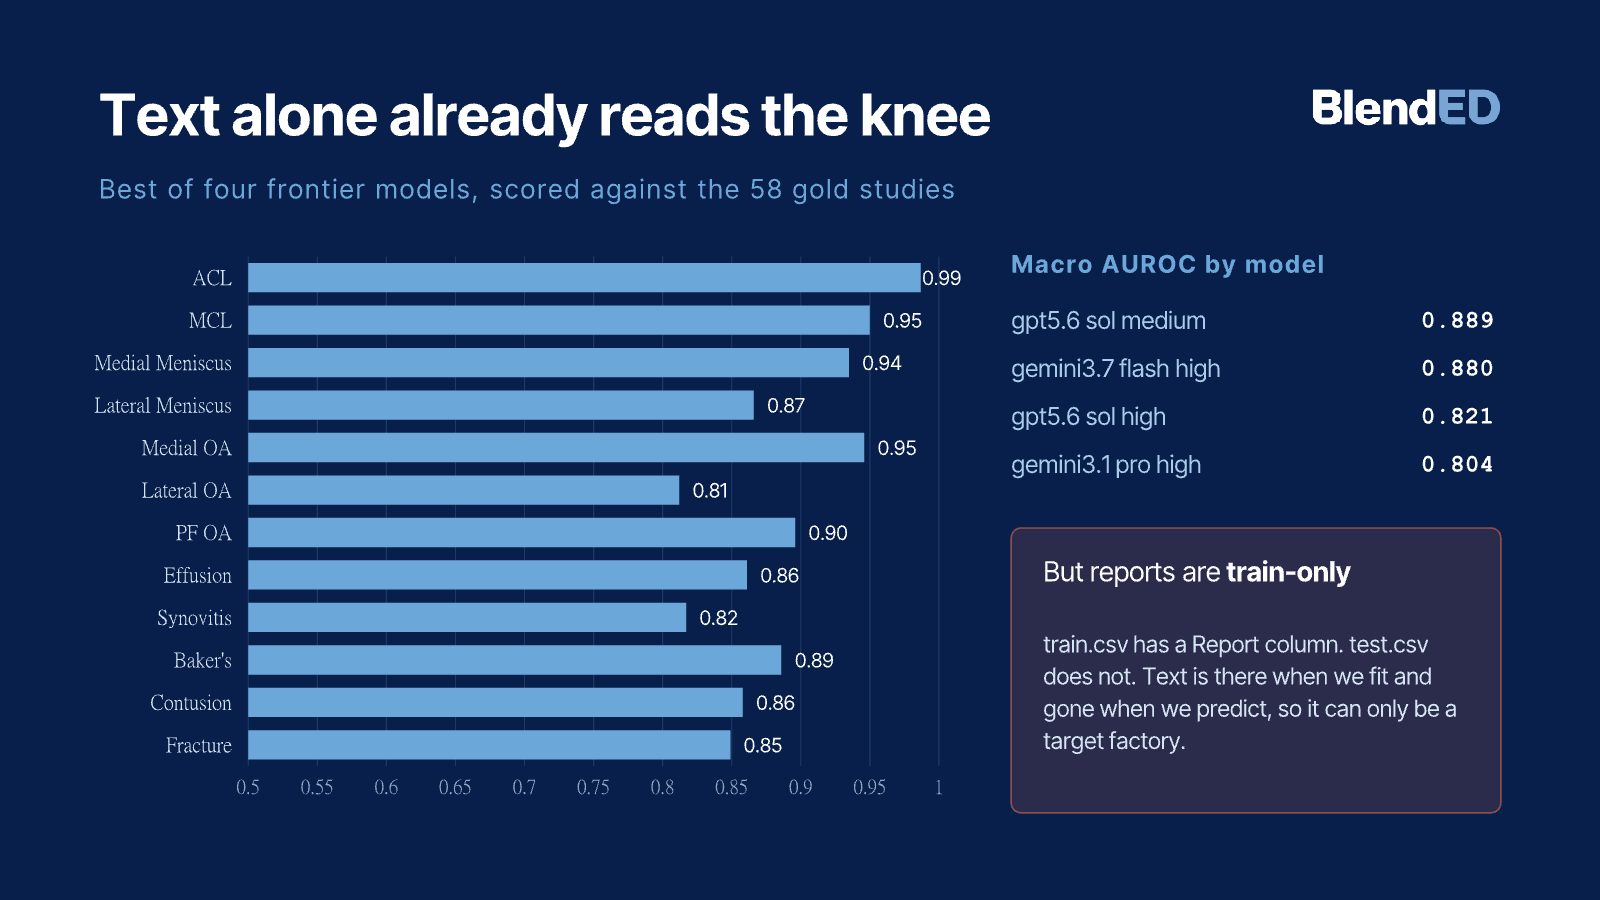
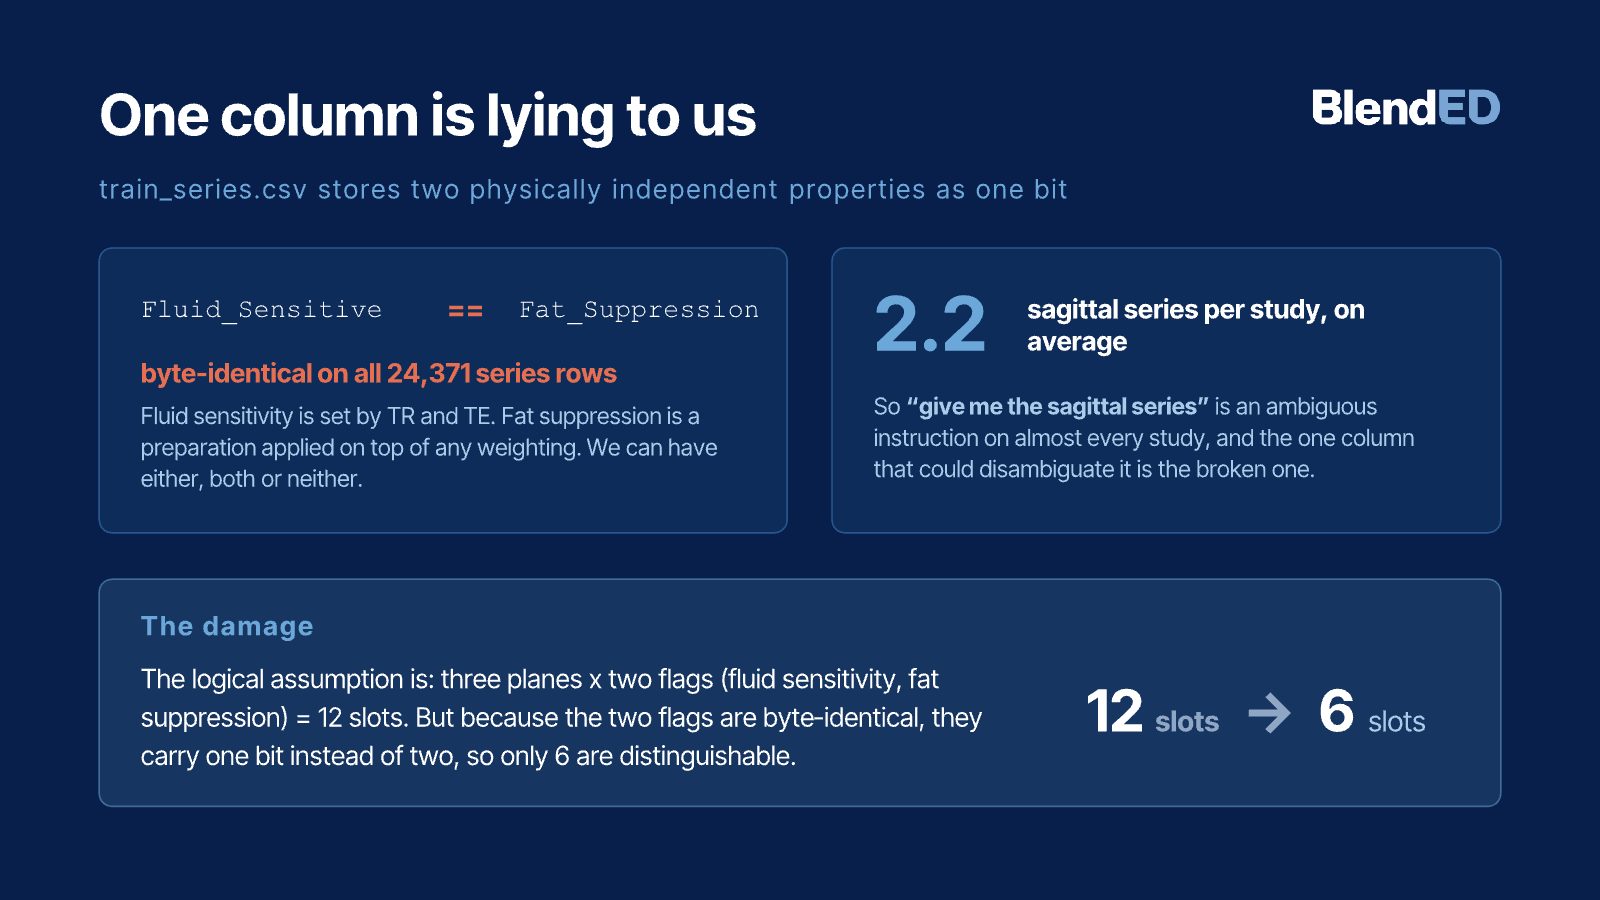
A knee MRI dataset with 4,407 studies looks large until you see that only 58 carry radiologist labels for 12 abnormalities, and that the rest come with free-text reports in several languages. Before training an image model, this team audited the data. They found that two metadata columns meant to describe different scan properties were byte-identical across all 24,371 series, which halves the series types a pipeline can tell apart, and they built a preprocessing path that orders slices from DICOM geometry and normalizes physical scale. They then used LLMs to turn reports into labels. The best of four frontier models reached a macro AUROC of 0.889 against the 58 radiologist labels, and the range across models was 0.80–0.89. A controlled comparison of six translation routes found English translation with NLLB worked best for non-English reports. There is no final image model yet; this is data and labeling work.
Keywords · medical imaging · knee MRI · data auditing · weak labels · LLM label extraction · DICOM
Who did this work
- Concentration focus
- AI + Vision & Language · AI + Business & Finance
- Concentration focus
- AI + Business & Finance · AI + Health Tech
- Concentration focus
- AI + Physical Intelligence · AI + Health Tech
- Concentration focus
- AI + Physical Intelligence
Students are not named. Year of study is as of fall 2026. Direction and goal come from each student's own program plan.
1A big dataset with almost no labels
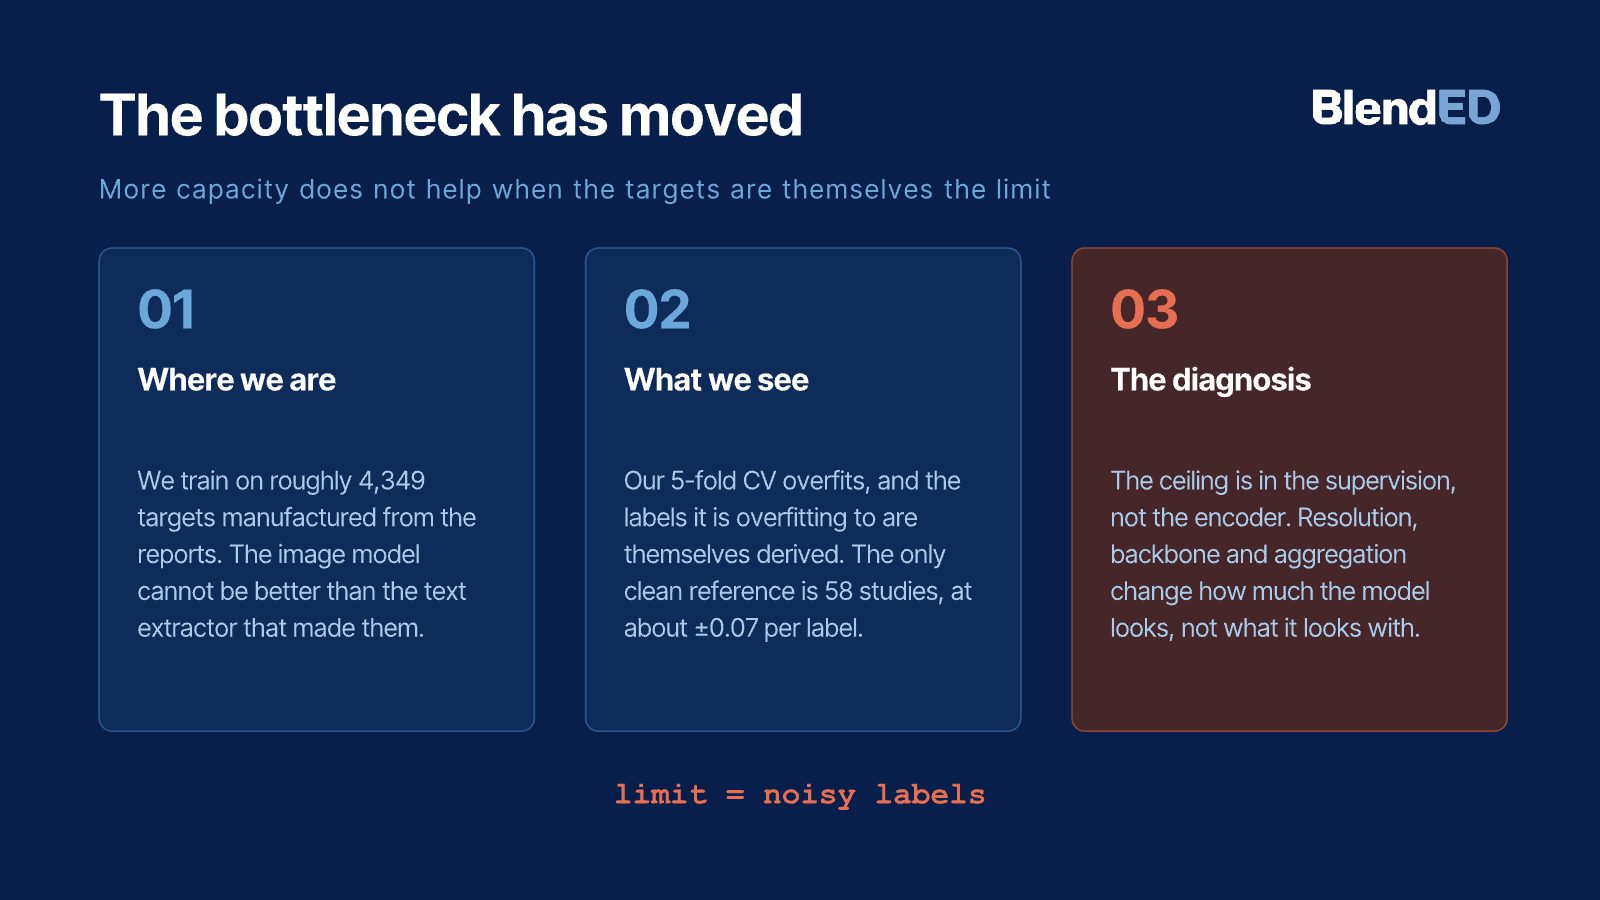
Clinical trials need to find patients with specific knee findings, such as a torn ligament or meniscus. An image model could screen MRIs for them, but it needs labeled examples. This dataset had 4,407 studies and only 58 with radiologist labels: barely a validation set, not a training set.
The rest had radiology reports, some not in English. And the reports exist only for the training data, so they cannot help at prediction time. The team's question was what it would take to turn this data into something a model could learn from honestly.
2Audit first, then label from text
- Opened the headers. Read the DICOM metadata behind every series instead of trusting the CSV summaries.
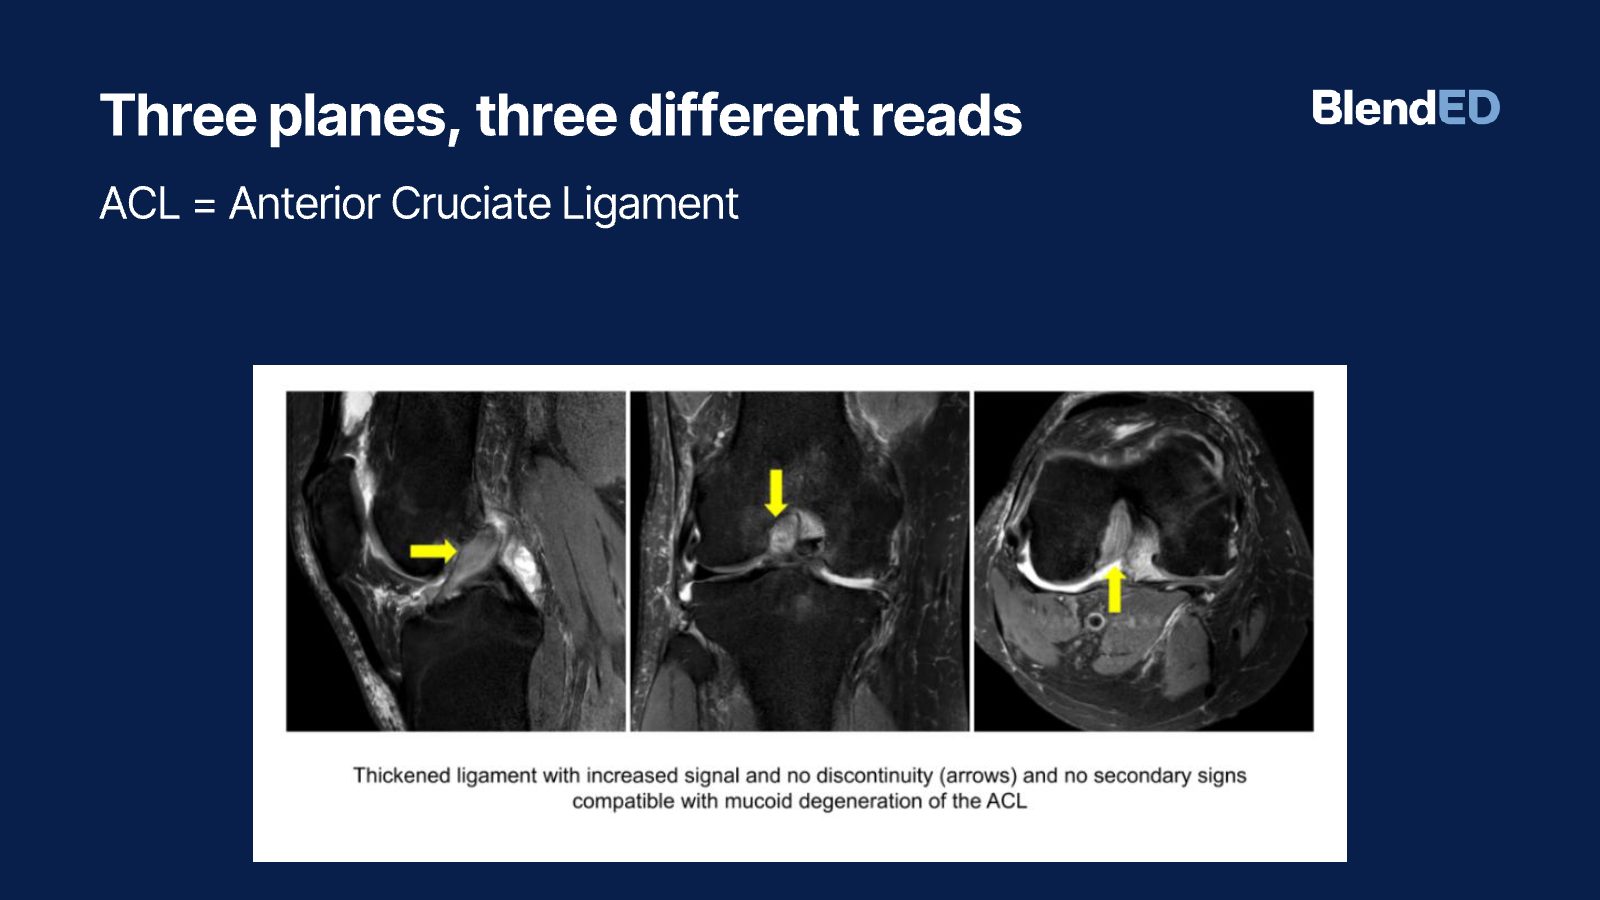
- Chose one series per plane. Kept one sagittal, coronal and axial series per study and restored slice order from ImageOrientationPatient and ImagePositionPatient.
- Normalized physical scale. Cropped 130 mm using PixelSpacing, corrected intensity, and skipped invalid crops instead of padding them with artificial pixels.
- Turned reports into labels. Ran LLMs on the reports with fixed settings and a strict prompt that requires quoted evidence and separates present, absent, uncertain and not mentioned.
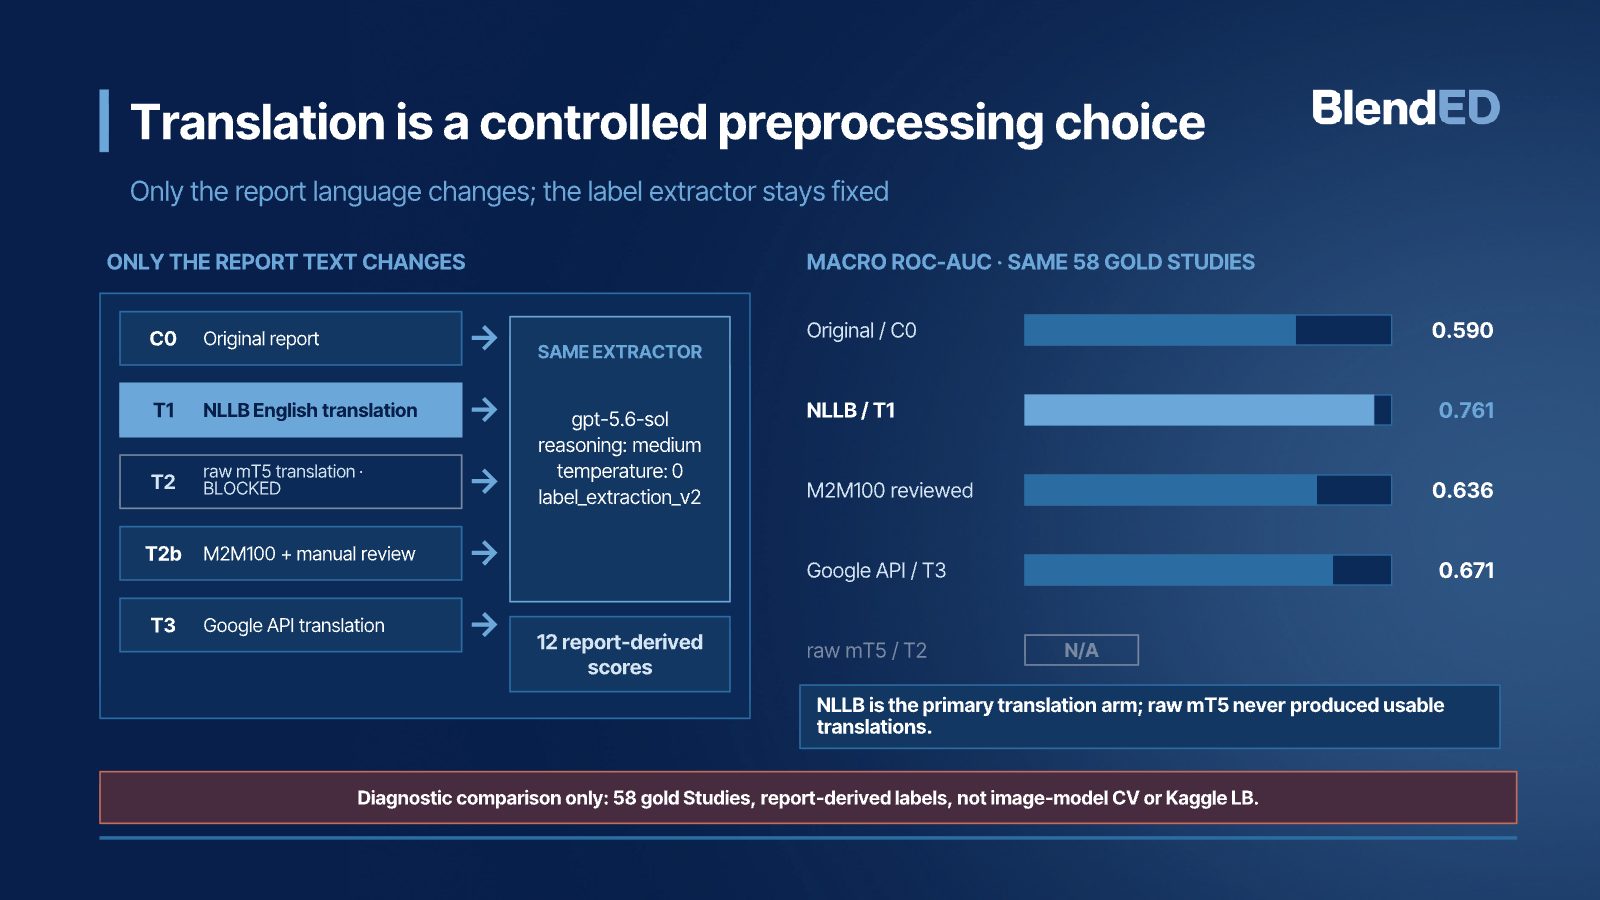
- Tested translation as a variable. Held the label extractor fixed and changed only the report language across six routes, scored against the 58 gold studies.
3Reports already carry the signal; one column did not
| Translation route (same extractor) | Macro ROC-AUC |
|---|---|
| NLLB English translation | 0.761 |
| Google API translation | 0.671 |
| M2M100 with two rounds of manual review | 0.636 |
| Raw mT5, mT5 with glossary | Failed before extraction (recorded as N/A) |
The stricter prompt scored lower than early exploratory runs. The team traced why: it produces only three score values, and 583 of 696 scores tied at 0.5, which removes the ranking information AUROC needs. They kept it because its labels can be audited.
4Selected slides
Selected slides from the team's final presentation. Student names are not shown.
5What this does not show
- There is no final image model yet. This is data and labeling work.
- All label quality numbers are measured against 58 studies, a small reference set.
- Reports exist only for training data, so labels from text cannot be used at prediction time.
- Not for clinical use.
6What this work shows the team can do
Researcher in Medical Imaging and Machine Learning
Senior Imaging Scientist at Novartis. MIT PhD in ultrasound imaging and medical robotics. Co-founded two medical startups.
The team audited the data, built the pipeline and ran the experiments during the On-Campus Experience. The Project Lead guided the work and reviewed the results.
Medical imaging · Biomedical data science · ML
Shows judgment about data quality before modeling, which matters in applied and research roles.
7What the Project Lead observed
After the project, the Project Lead wrote an evaluation of each student and placed each one on a four-level scale. This section shows the highest level reached on the team. The notes below describe the team's project. Individual ratings are not published.
System-Level Insight
- 1Foundational Application
- 2Applied Reasoning
- 3Independent Problem Solving
- 4System-Level Insight
Level 4 of 4: anticipates broader implications, risks or downstream effects, and connects technical decisions to real-world impact.
- Framing the problem
- Standardized the report-labeling pipeline with the same model, settings and prompt across all 12 knee findings, so report language was the only variable.
- Decisions and trade-offs
- Compared six translation routes for accuracy, cost and feasibility. Recorded unreliable translation routes as N/A instead of pushing bad data downstream. Chose one series per plane and a physical 130 mm crop to cut memory use and spatial artifacts.
- Evidence and testing
- Evaluated labels against the 58 benchmark studies with macro and per-label ROC-AUC, PR-AUC, file hashes, ID checks and exact-quote checks. Explained why the stricter prompt lowered ROC-AUC: a three-point scale created 583 ties out of 696 scores.
- Limits and risk
- Designed the prompt to forbid unsupported medical inference and require quoted evidence, putting patient safety ahead of a higher score. Used DICOM geometry to guarantee slice order and resolve laterality conservatively.
Source: the Project Lead's written evaluations, August 2026.
References
- Mason, D. et al. pydicom: an open source DICOM library (software).
- NLLB Team (2022). No Language Left Behind: Scaling human-centered machine translation. arXiv:2207.04672.
- Hanley, J. A. & McNeil, B. J. (1982). The meaning and use of the area under a ROC curve. Radiology, 143(1), 29–36.
Join the AI and Computer Vision in BioTech – Novo Nordisk Project
This outcome came out of this project. Work with a medical imaging scientist on real clinical data, and leave with work you can show.