Why can an AI system be slow when its GPUs are not full?
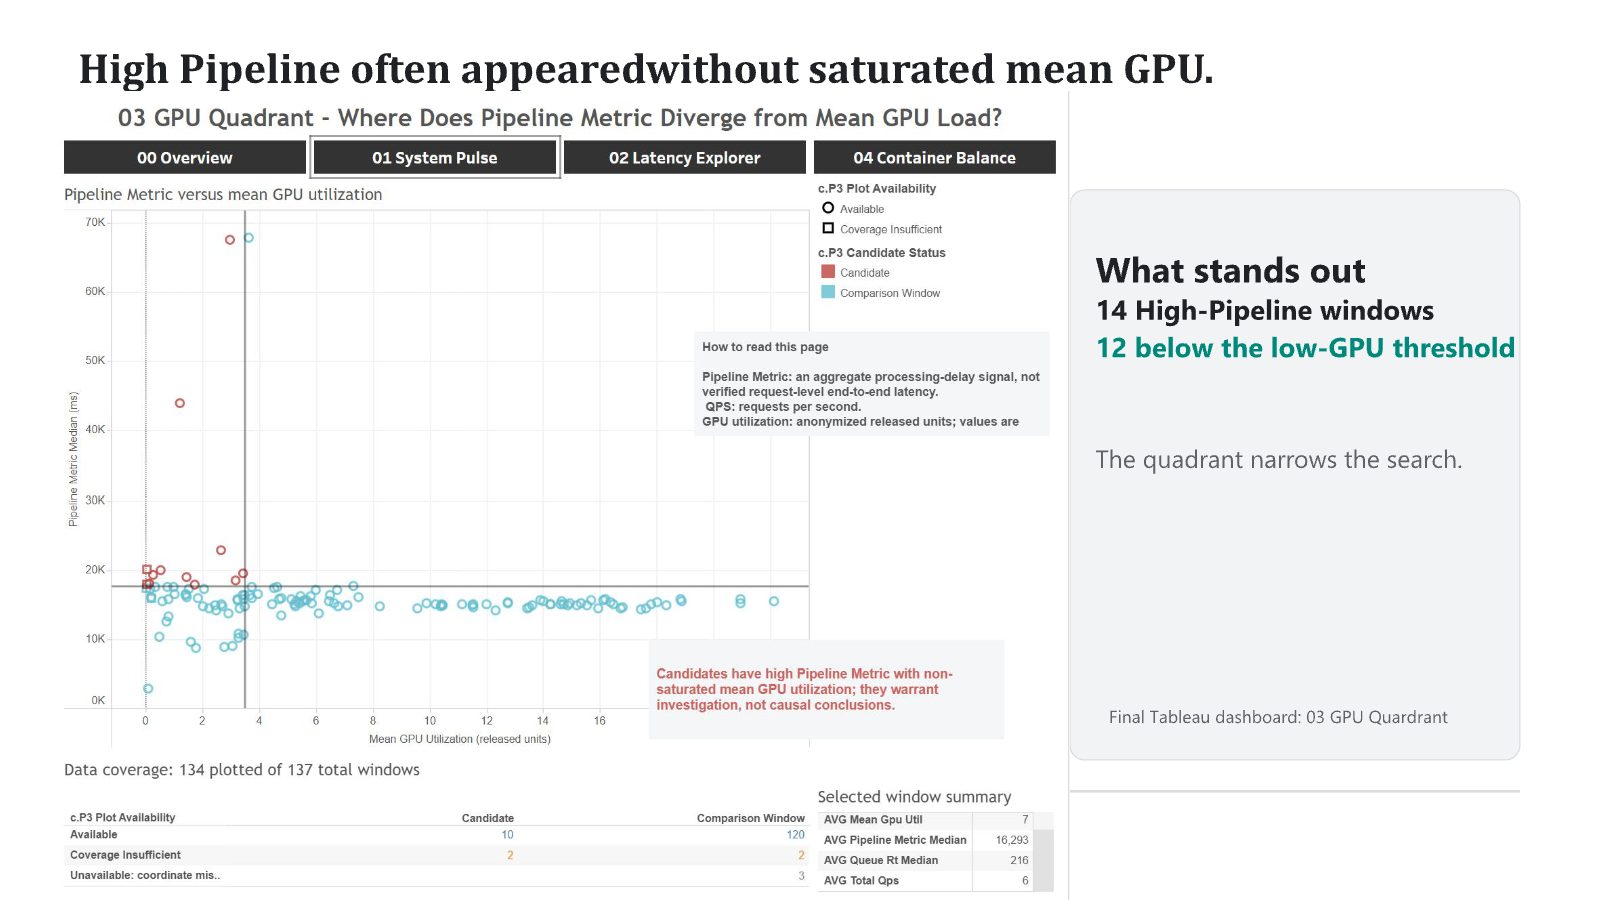
Using real cluster traces from Alibaba, a team of two students built five linked Tableau views to diagnose processing delay. In 12 of 14 high-delay windows, average GPU use was below the low-use threshold, so GPU use alone does not explain the delay.
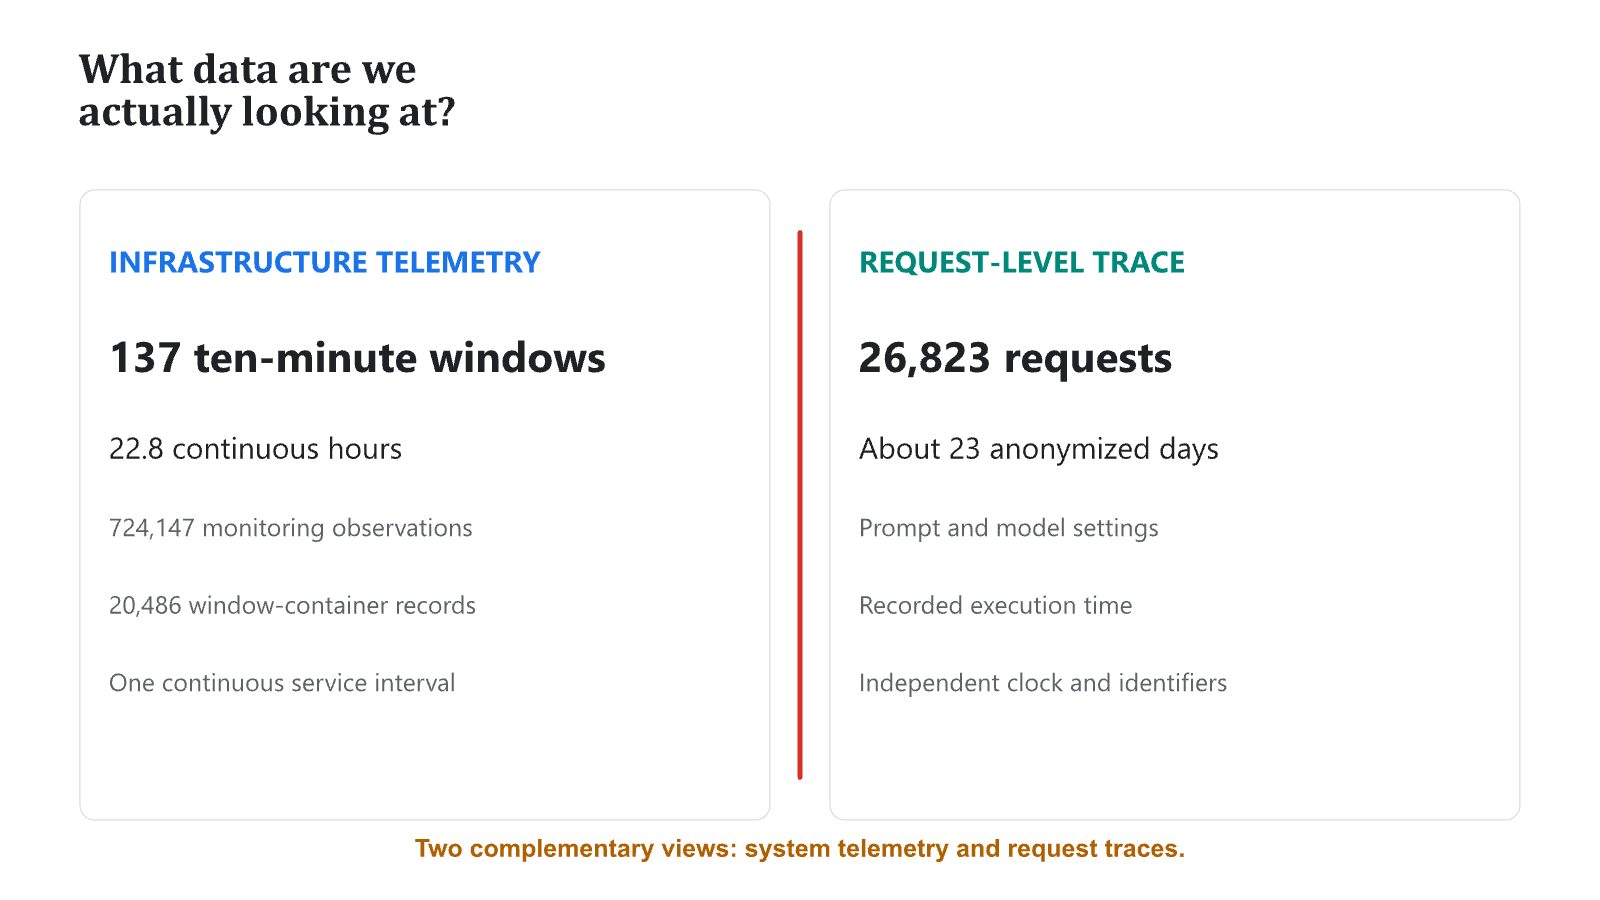
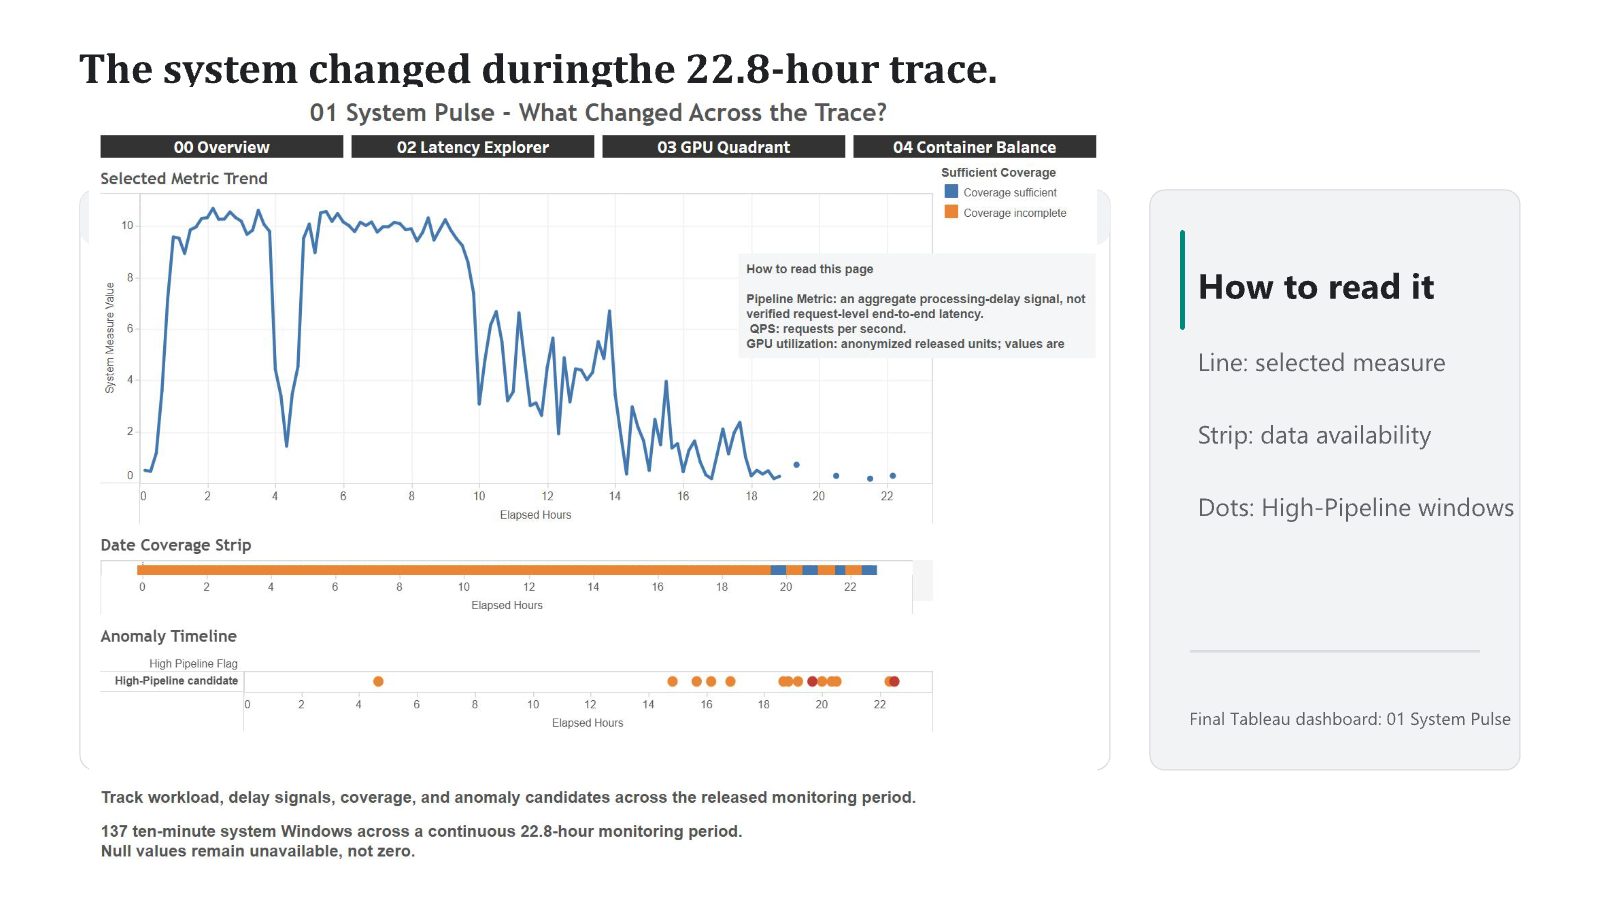
Teams that run AI services often read GPU utilization as the main sign of load. This team asked why processing delay can be high when GPUs are not saturated. Using Alibaba's GenTD26 traces, 724,147 monitoring records across 137 ten-minute windows and a separate trace of 26,823 requests, they built five linked Tableau views around four questions: what changed over time, what appeared alongside high delay, whether the GPU was full, and what the system average hid about individual containers. In 12 of 14 high-delay windows, mean GPU utilization was below the low-use threshold. Queue conditions, data coverage, loading activity and uneven container load each added context, but no single signal explained every window. The team presents the dashboard as a tool that narrows the next investigation, not as a root-cause answer. The two traces were deliberately not joined, because their clocks and identifiers differ.
Keywords · data visualization · Tableau · GPU scheduling · cloud computing · diagnostics · AI infrastructure
Who did this work
- Concentration focus
- AI + Business & Finance · AI + Health Tech
- Concentration focus
- AI + Physical Intelligence
Students are not named. Year of study is as of fall 2026. Direction and goal come from each student's own program plan.
1GPU use is only part of the story
AI services run on shared GPU clusters. When requests slow down, the first thing operators check is whether the GPUs are busy. But delay can also build up in queues, in loading steps, in where work is placed, and in containers that carry far more load than others.
Alibaba's GenTD26 dataset includes GPU cluster telemetry and request traces from generative AI workloads. The team used it to ask a practical question: when processing delay is high, is the GPU actually full, and if not, what else is going on?
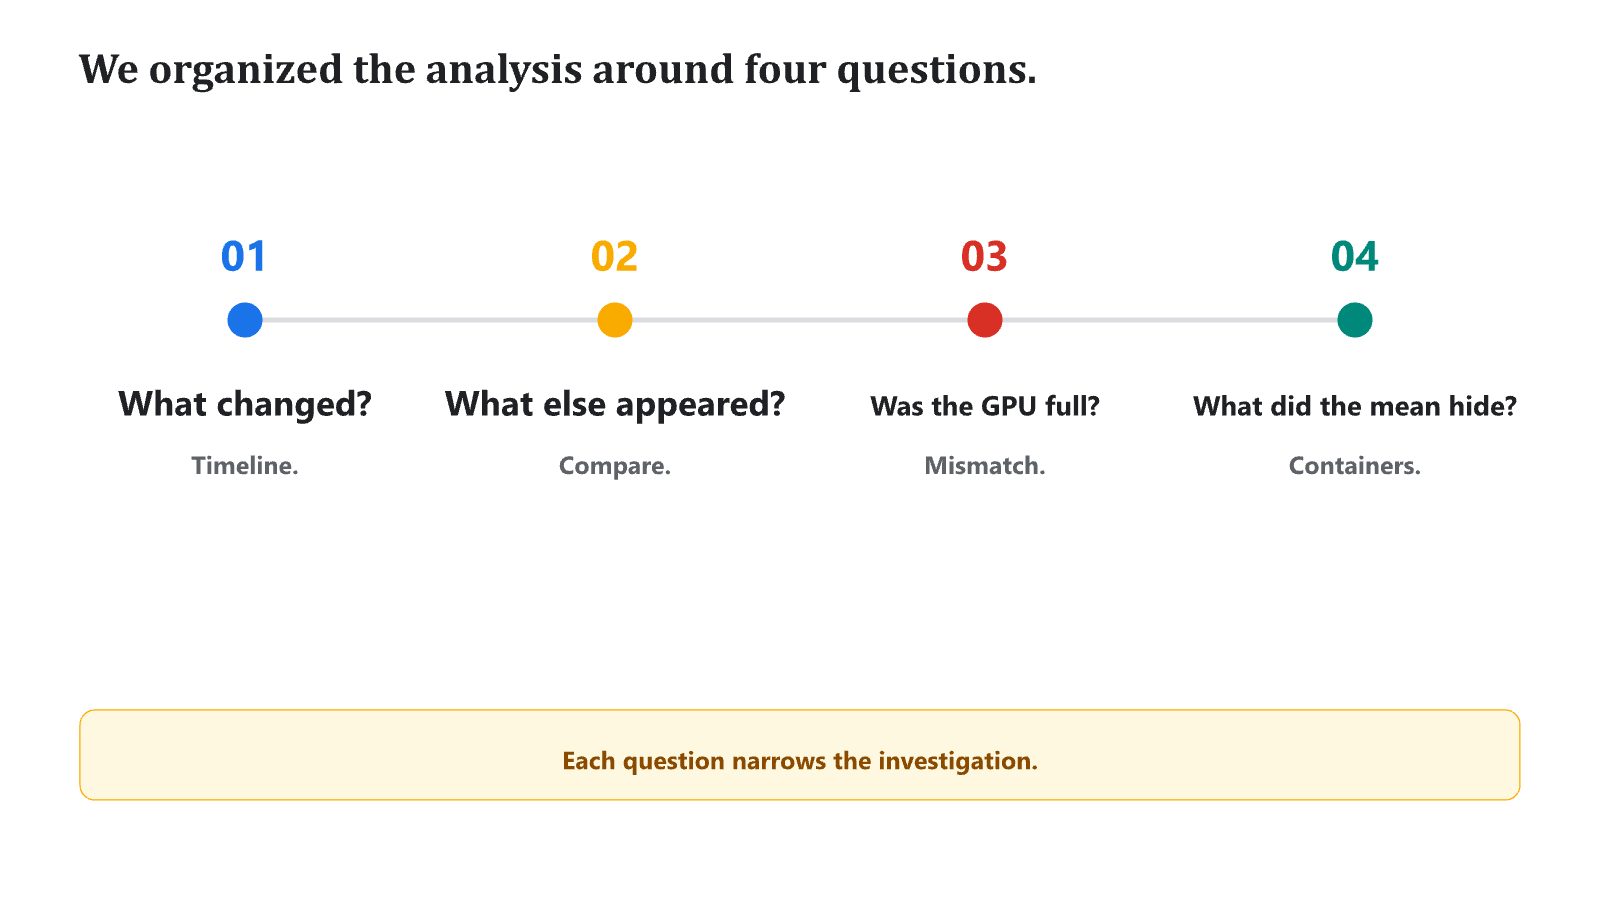
2Four questions, one view each
- Kept two traces separate. Infrastructure telemetry (724,147 records, 137 ten-minute windows, 22.8 hours) and request data (26,823 requests over about 23 days) have different clocks and IDs, so the team did not join or time-match them.
- Planned a reading order. Split the main question into four smaller ones and gave each its own view, titled as a question.
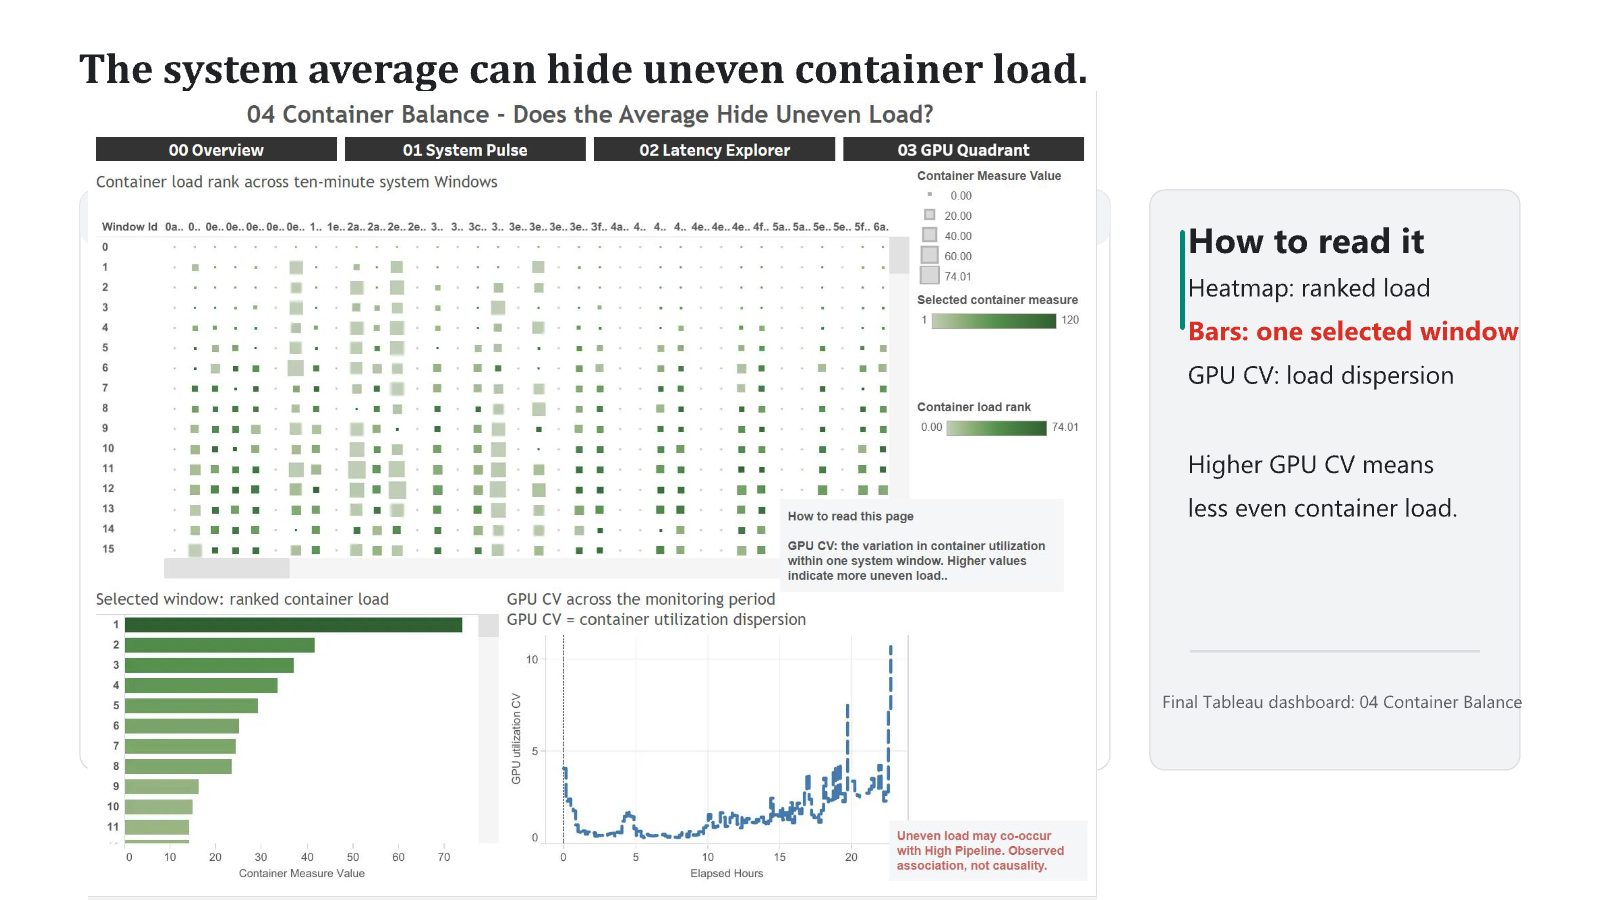
- Matched charts to questions. A line chart for change over time, box plots with points for group comparisons, a quadrant scatter for the GPU mismatch, and a heatmap with ranked bars for load spread.
- Linked the views. Used parameters, filters, cross-page actions and tooltips, so picking one time window updates the related charts and tables.
- Showed what is missing. Kept missing values missing instead of turning them into zero, and printed valid and missing counts on the page.
3High delay without a full GPU
Queue conditions, data coverage, loading activity and uneven container load each added context, but no single one explained every window. The Container Balance view showed that the system average hid large differences between containers.
4Selected slides
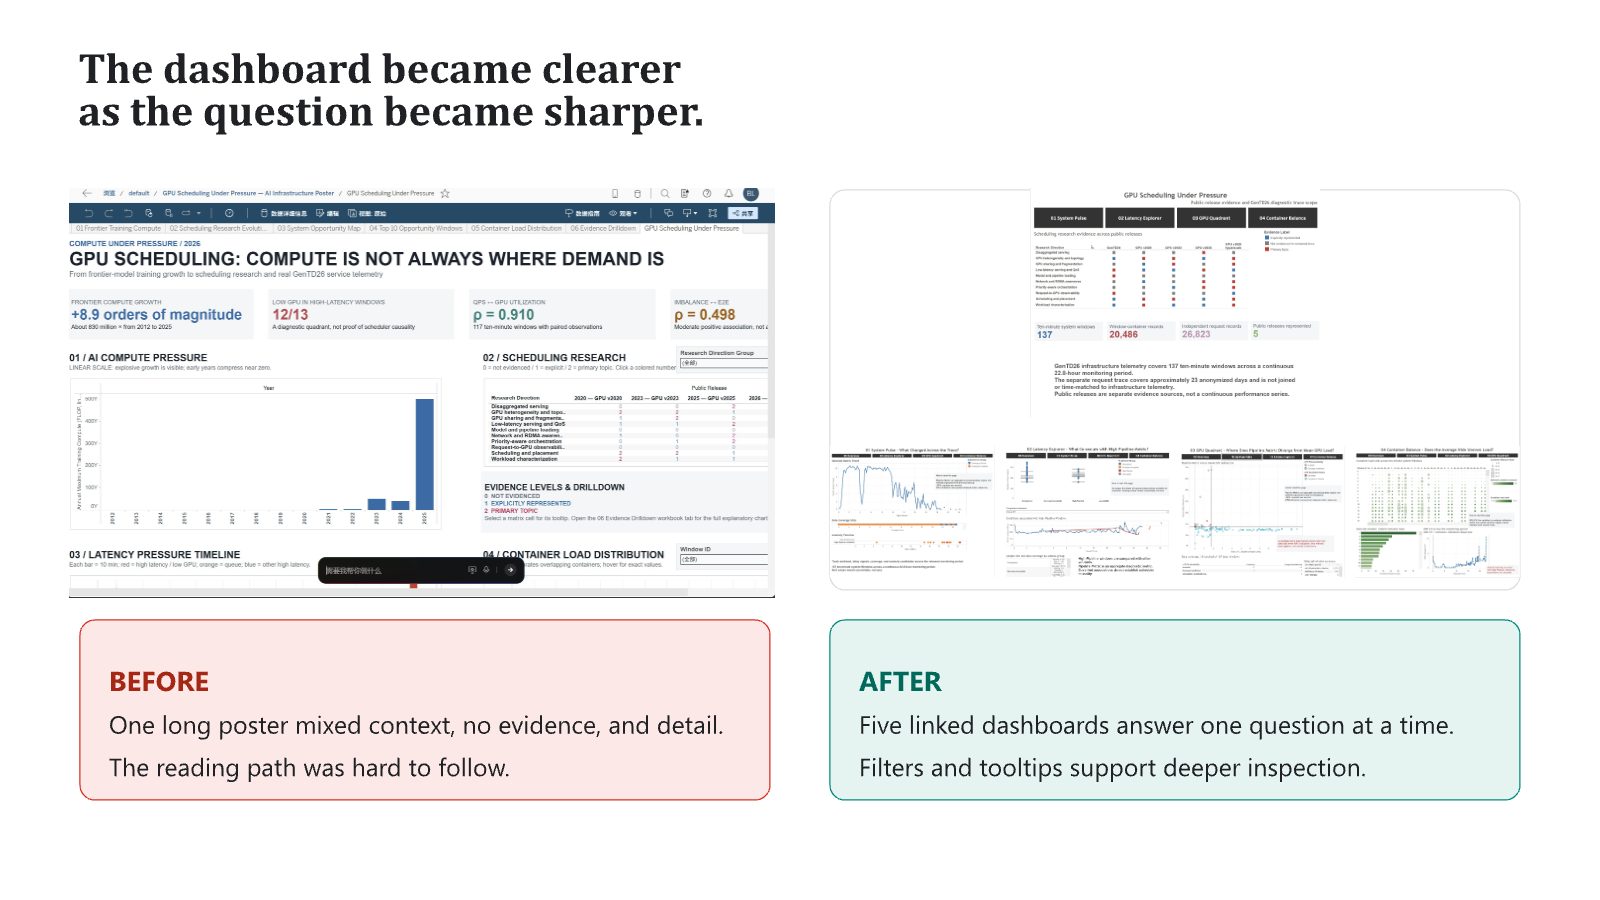
Selected slides from the team's final presentation. Student names are not shown.
5What this does not show
- The views show patterns that appear together, not causes.
- The infrastructure and request traces are not matched, so delay cannot be traced to individual requests.
- Pipeline Metric is a released processing-delay signal, not end-to-end user latency.
- The Project Lead noted that some labels and legends were left in raw form, which makes the dashboards harder to read for newcomers.
6What this work shows the team can do
Faculty in Data Visualization and Human-Computer Interaction
Faculty at Boston College. Leads the Data Within Reach Group. Awards from ACM CHI, ACM UIST and Information is Beautiful. Harvard PhD.
The team built the dashboards and analysis during the On-Campus Experience. The Project Lead reviewed the design and the reasoning behind it.
Data visualization · Data science · Cloud and AI infrastructure
A working, question-led dashboard on real industry traces works well as a portfolio piece.
7What the Project Lead observed
After the project, the Project Lead wrote an evaluation of each student and placed each one on a four-level scale. This section shows the highest level reached on the team. The notes below describe the team's project. Individual ratings are not published.
Independent Problem Solving
- 1Foundational Application
- 2Applied Reasoning
- 3Independent Problem Solving
- 4System-Level Insight
Level 3 of 4: evaluates alternatives, adapts the approach based on evidence or constraints, and works with meaningful independence.
- Framing the problem
- Built the project around one clear question, why a system can be slow when its GPUs are not full, then split it into four smaller questions with one view each. The reading order was planned and each page title is a question.
- Decisions and trade-offs
- Chart choices matched the questions: line charts for change over time, box plots with points for comparing groups, a quadrant scatter for the mismatch, and a heatmap with ranked bars for load spread. Navigation and layout stay the same on every page.
- Evidence and testing
- Used parameters, filters, cross-page navigation and linked selection. Showed counts on the page, including how many windows were plotted and the valid and missing counts per group. Rebuilt a single long poster into five linked pages.
- Limits and risk
- Stated on every page that patterns are observed, not causal, that missing values stay missing, and that the two data sources are not matched. Framed the dashboard as a tool that narrows the next investigation.
Where the Project Lead pushed further. Lower the barrier for readers outside systems work: rename raw legends and field names, and make the heatmap column labels readable.
Source: the Project Lead's written evaluations, August 2026.
References
- Alibaba Group. GenTD26: GPU cluster traces for generative AI workloads (public dataset release).
- Munzner, T. (2014). Visualization Analysis and Design. CRC Press.
- Tableau Software. Dashboard actions and parameters (product documentation).
Join the AI and Data Visualization for Social Impact – Tableau Project
This outcome came out of this project. Work with a data visualization researcher on real industry data, and leave with a dashboard you can show.