Can well injection and production data forecast earthquakes in the Los Angeles Basin?
Working alone, Qi Hui Choy merged well, injection, production and earthquake data for the Los Angeles Basin on a spatial grid, then trained XGBoost models to forecast earthquake rate and average magnitude 3 months, 1 year and 5 years ahead. Accuracy rose with the horizon: for earthquake rate, R² went from 0.367 at 3 months to 0.842 at 5 years.
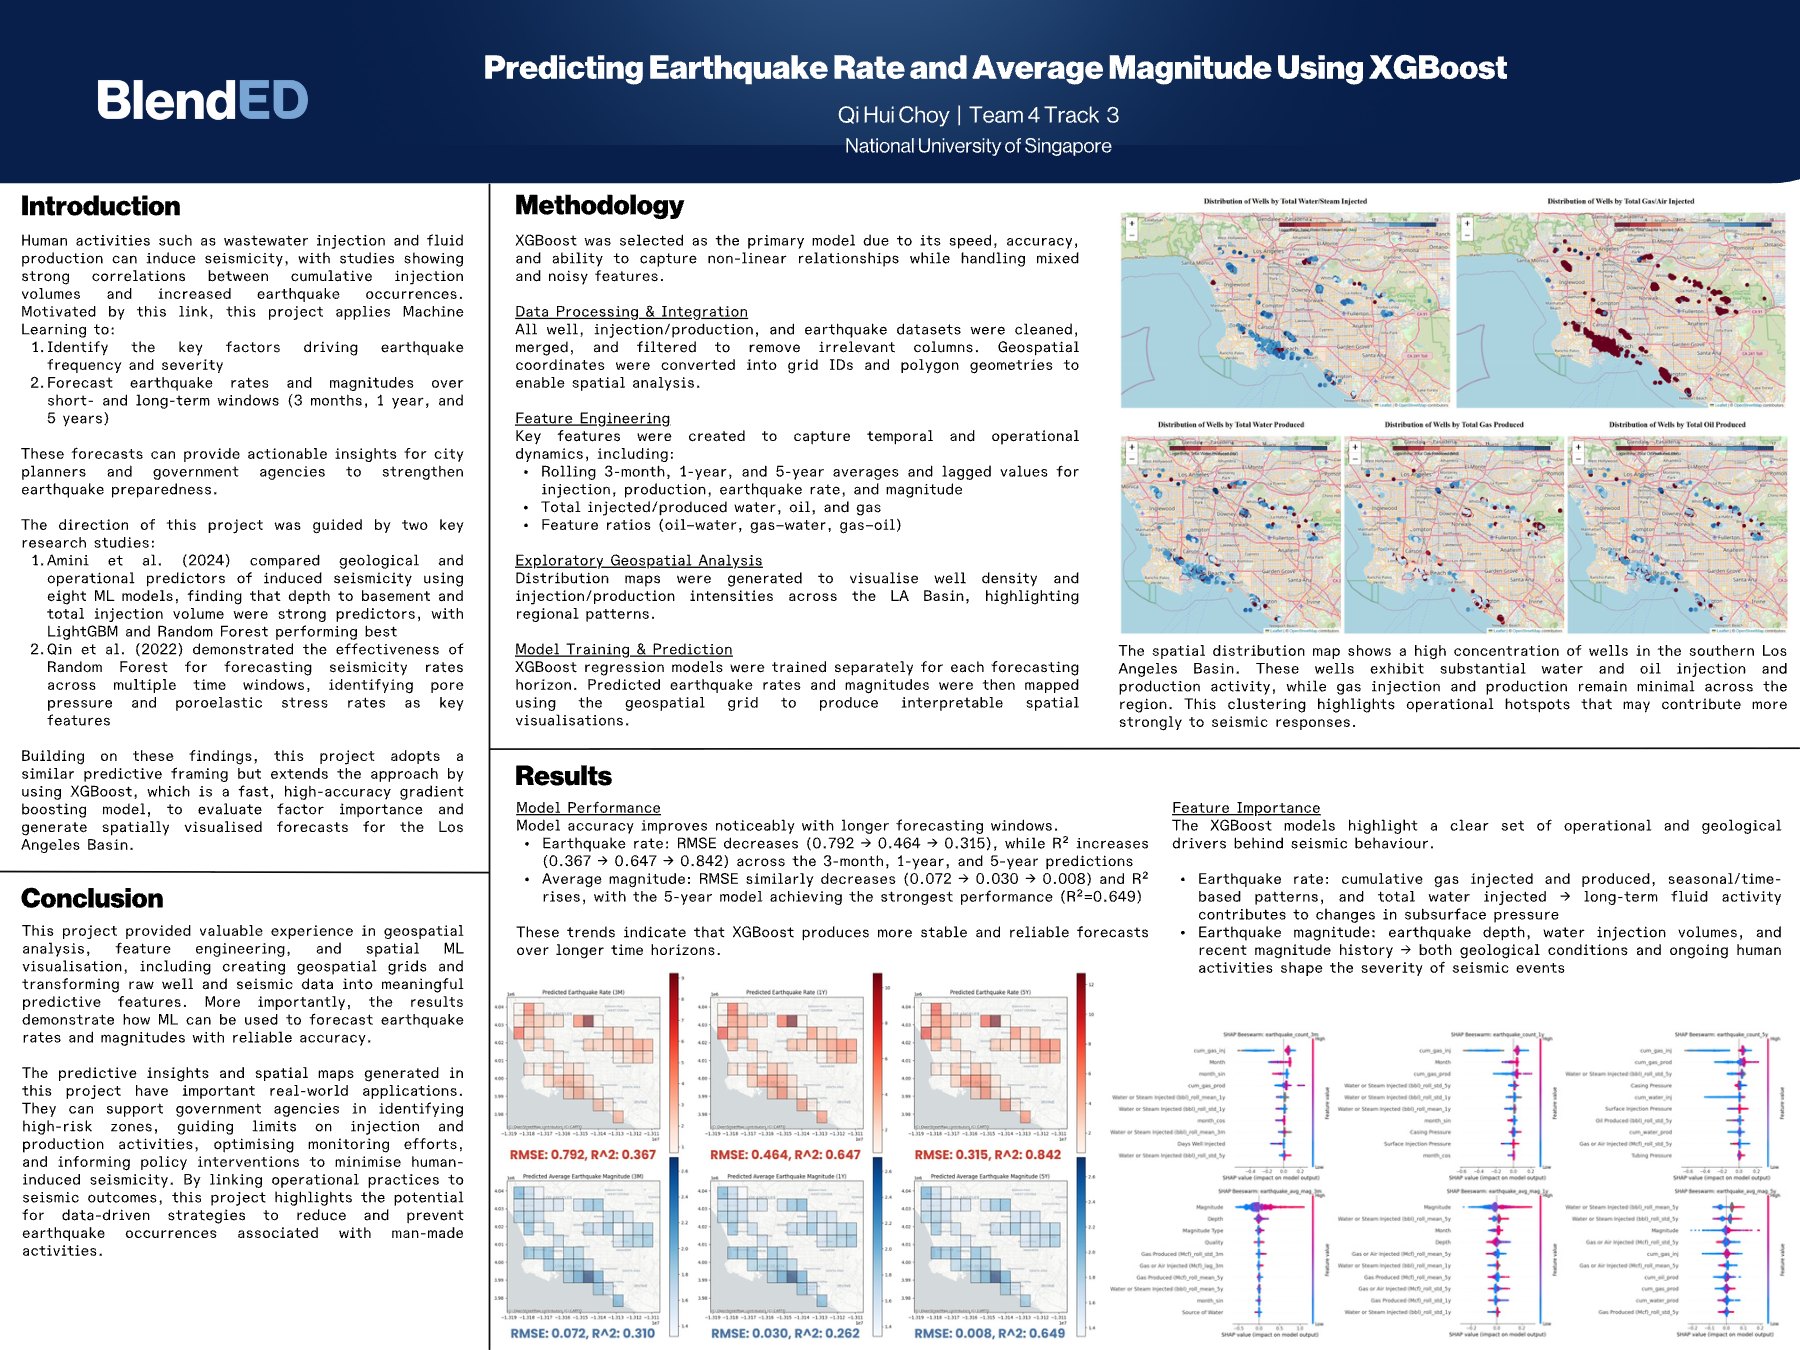
Wastewater injection and fluid production can induce earthquakes. This project asked whether operational data can forecast earthquake rate and average magnitude in the Los Angeles Basin. Well, injection, production and earthquake datasets were cleaned and merged, and coordinates were converted into grid cells for spatial analysis. Features included rolling 3-month, 1-year and 5-year averages, lagged values, cumulative injected and produced water, oil and gas, and ratios between them. Separate XGBoost regression models were trained for each horizon. For earthquake rate, RMSE fell from 0.792 to 0.464 to 0.315 and R² rose from 0.367 to 0.647 to 0.842 across the 3-month, 1-year and 5-year forecasts. For average magnitude, RMSE fell from 0.072 to 0.030 to 0.008, with the 5-year model reaching R² 0.649. Cumulative gas injection and production and total water injected mattered most for rate; earthquake depth, water injection and recent magnitude history mattered most for magnitude. Forecasts were mapped across the basin.
Keywords · induced seismicity · XGBoost · geospatial analysis · feature engineering · Los Angeles Basin · forecasting
Who did this work

- On this project
- Scoped and ran the whole project alone while most of the cohort worked in teams.
Students named here agreed to be featured. Role notes come from the Project Lead's feedback.
1Human activity and earthquakes
Studies have linked cumulative injection volumes to more frequent earthquakes. If operational data carries that signal, forecasts could help agencies spot high-risk zones.
The project built on two earlier machine-learning studies of induced seismicity and extended the approach with XGBoost and spatial maps of the Los Angeles Basin.
2From raw well data to spatial forecasts
- Merged the data. Cleaned and merged well, injection, production and earthquake datasets; converted coordinates to grid cells and polygons.
- Engineered features. Rolling 3-month, 1-year and 5-year averages and lags; total injected and produced water, oil and gas; oil–water, gas–water and gas–oil ratios.
- Trained per horizon. Separate XGBoost regression models for 3-month, 1-year and 5-year forecasts of rate and average magnitude.
- Mapped the results. Plotted well density, injection and production, and predicted rates across the basin.
3Longer horizons forecast better
| Horizon | Rate RMSE | Rate R² | Magnitude RMSE |
|---|---|---|---|
| 3 months | 0.792 | 0.367 | 0.072 |
| 1 year | 0.464 | 0.647 | 0.030 |
| 5 years | 0.315 | 0.842 | 0.008 |
- Earthquake rate: cumulative gas injected and produced, seasonal patterns and total water injected were the strongest drivers.
- Average magnitude: earthquake depth, water injection volumes and recent magnitude history were the strongest drivers.
4The poster
The final poster.
5What this does not show
- Feature importance shows association, not cause.
- Longer windows average out short-term noise, so higher R² does not mean individual earthquakes can be predicted.
- The poster does not describe how the test period was separated from training data.
6What this work shows
Researcher in Geophysics and Subsurface Modelling
Researcher in earthquake hazards at MIT Civil and Environmental Engineering and Harvard Earth and Planetary Sciences, with industry experience in energy-related subsurface work.
The student did the analysis and modeling. The Project Lead guided the work and reviewed it.
Environmental data science · Energy · Geoscience
An independent project with clear metrics and maps shows research readiness.
7What the Project Lead observed
The Project Lead wrote feedback on the project at the end of the program.
Written feedback only
This cohort ran before the four-level capability rating was recorded, so this page shows the Project Lead's written feedback without a level.
- Initiative
- Scoped, executed and advanced a complex modeling project entirely alone, while most peers worked in teams.
- Quality
- Delivered high-quality results; the Project Lead placed the work in the top 10% of the PBL cohort.
- Work habits
- The Academic Coordinator noted her intellectual rigor, organization and clear ownership.
Source: the Project Lead's and Academic Team's written feedback, 2025.
References
- Chen, T. & Guestrin, C. (2016). XGBoost: A scalable tree boosting system. KDD.
- Amini et al. (2024), comparing geological and operational predictors of induced seismicity with machine learning (as cited in the poster).
- Qin et al. (2022), Random Forest forecasting of seismicity rates across time windows (as cited in the poster).
Join the AI for Energy and Sustainability – Shell Project
Work with a geophysics researcher on energy and environmental data and leave with research you can show.