Upload a brain MRI. Get the tumor outlined and its volume measured.
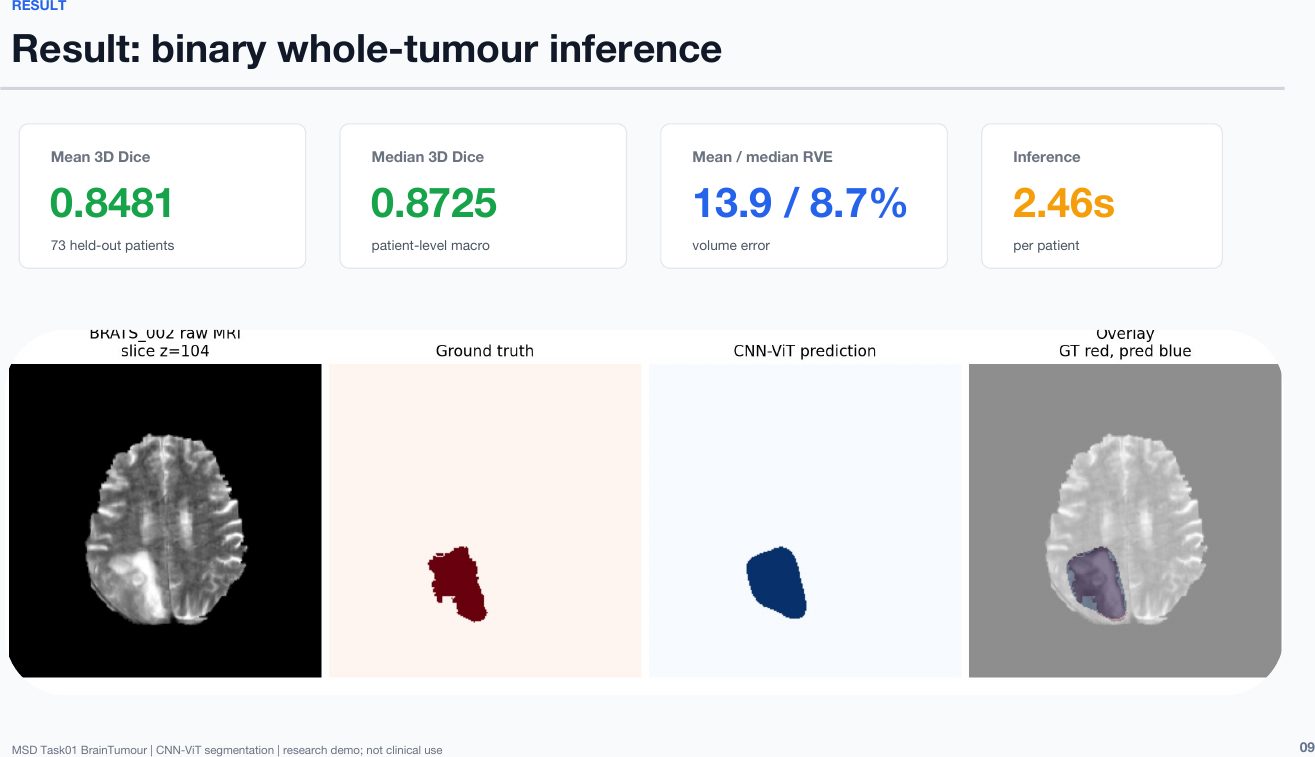
A team of three students adapted a pretrained vision model to read brain MRI scans and turned it into a working web tool. On 73 patients the model had never seen, its tumor outlines matched radiologists' at 0.848 on a 0–1 overlap scale.
Measuring a brain tumor still depends on experts tracing it by hand, slice by slice. This team adapted an ImageNet-pretrained hybrid CNN–Vision Transformer to four-sequence brain MRI, trained it on a patient-level split stratified by tumor volume, and evaluated it once on 73 held-out patients. Whole-tumor overlap with expert labels reached a Dice score of 0.848, matching validation, compared with 0.48 for a model trained from scratch. The model was deployed as a web tool that segments, measures and exports tumor volume. Results come from a public research dataset and are not intended for clinical use.
Keywords · brain MRI · tumor segmentation · volumetry · transfer learning · Vision Transformer · held-out evaluation
Who did this work
- Role in this project
- Led the core pipeline: audited the data, designed the patient split, adapted the pretrained model to four-sequence MRI, ran training and the held-out evaluation, then designed and deployed the web tool.
- Background
- Fourth AI+X project in five months.
- Background
- Came in from machine learning on biological data: in an earlier AI+X project, built classifiers that tell breastfed from formula-fed infants using gut-microbiome data.
- Background
- A cellist who came to AI+X with no prior programming background.
Students are not named. Year of study is as of the August 2026 project. Roles come from the team's final presentation and their own project write-ups.
1Why measure tumors automatically?
To track a brain tumor, a clinician traces its border slice by slice across dozens of MRI images. It is slow, and two experts rarely draw exactly the same line.
In drug trials, a change in tumor volume is one of the clearest signs of whether a treatment works. A tool that outlines tumors consistently turns "visible on a scan" into a number that can be compared over time.
2From raw scans to a working tool
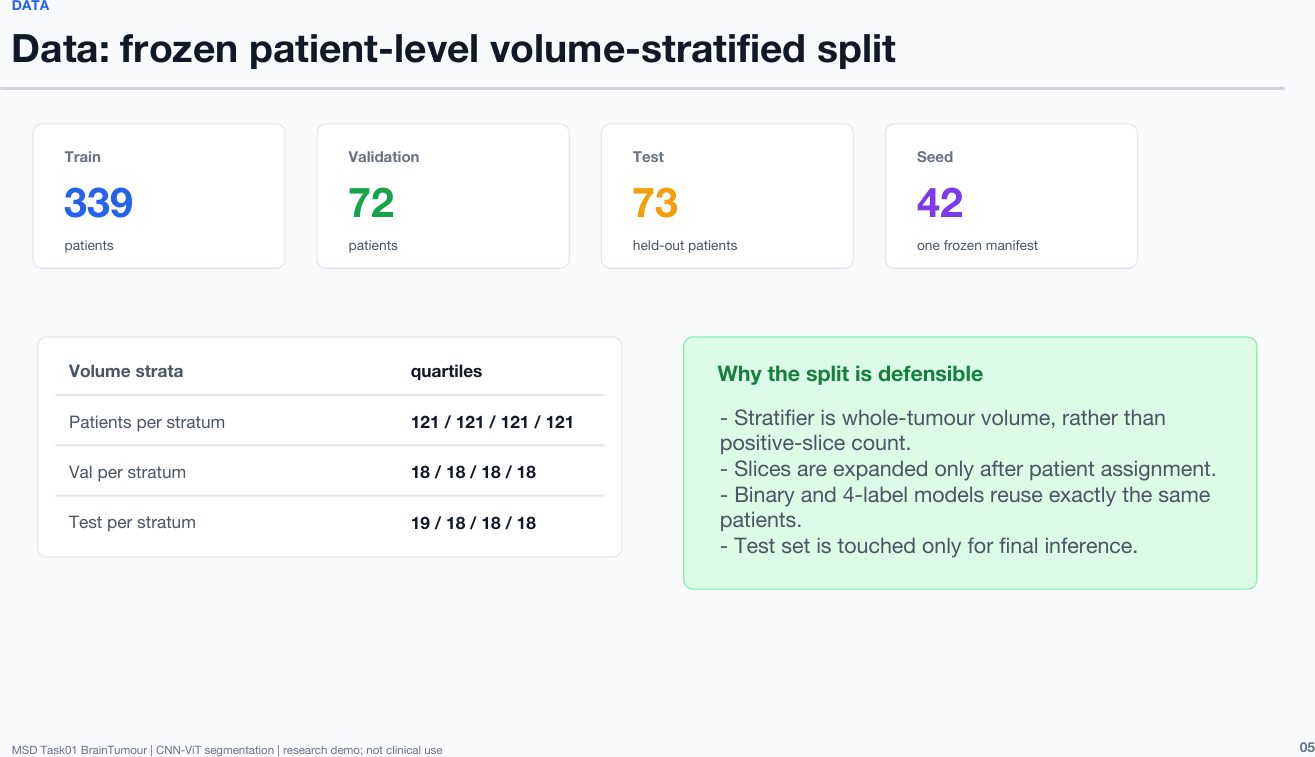
- Audited the data first.484 patients from the Medical Segmentation Decathlon brain tumor task [1], each with 155 image slices and four MRI sequences. Tumor sizes ranged from 7 to 318 mL, so the team made sure every group would contain small, medium and large tumors.
- Split patients, not images.Each patient appears in only one group. The test group was locked away until the very end.
- Built a from-scratch baseline.Starting from a transformer script the Project Lead provided, a teammate trained a model from zero. It reached only 0.48 overlap, which set a clear bar to beat.
- Adapted a pretrained model.The team took a hybrid ResNet–Vision Transformer [2] pretrained on millions of everyday images and modified its input layer to read all four MRI sequences at once.
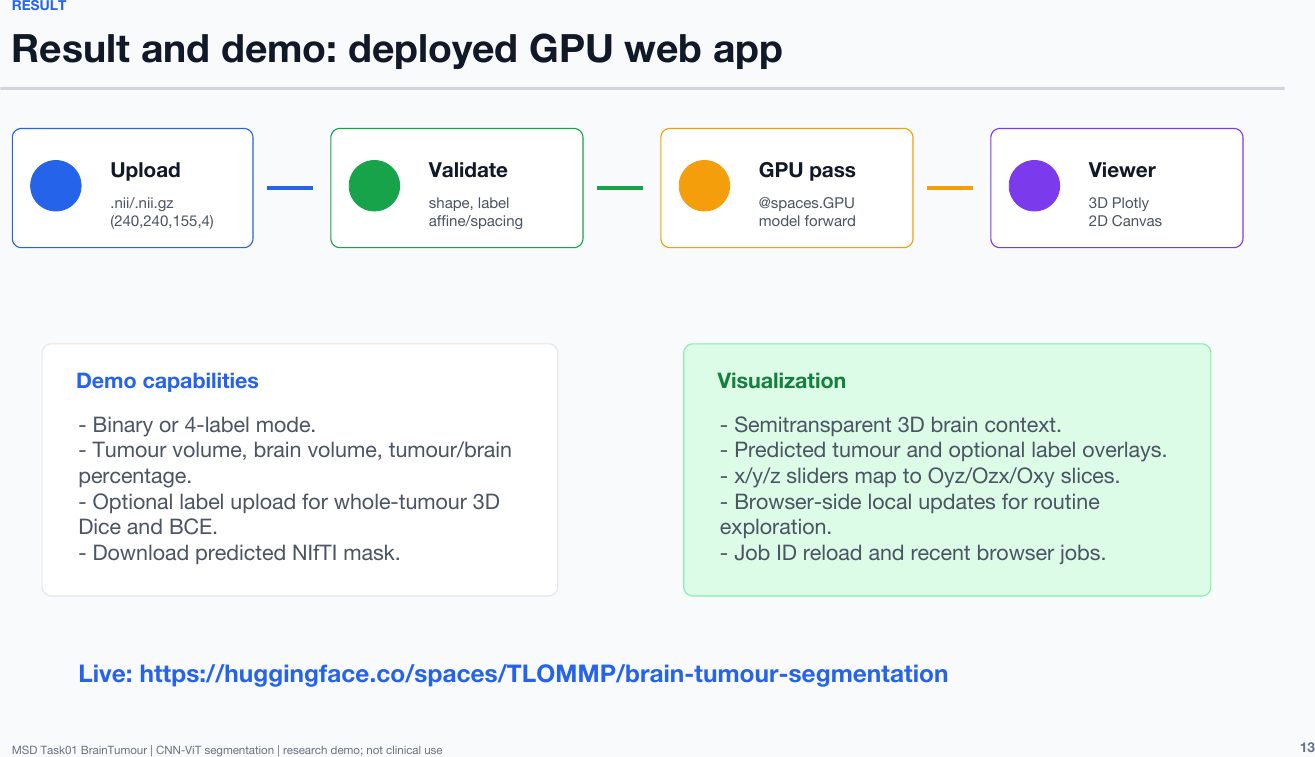
- Shipped it as a web tool.The team deployed the model on Hugging Face: upload a scan, inspect the outline in 2D and 3D, read the volume, and export the result.
3Pretraining made the difference, and the result held on new patients
| Model | Evaluated on | Mean Dice [3] | Median volume error |
|---|---|---|---|
| From-scratch ViT baseline | Validation | 0.48 | — |
| Pretrained CNN–ViT | Validation (72) | 0.848 | 8.2% |
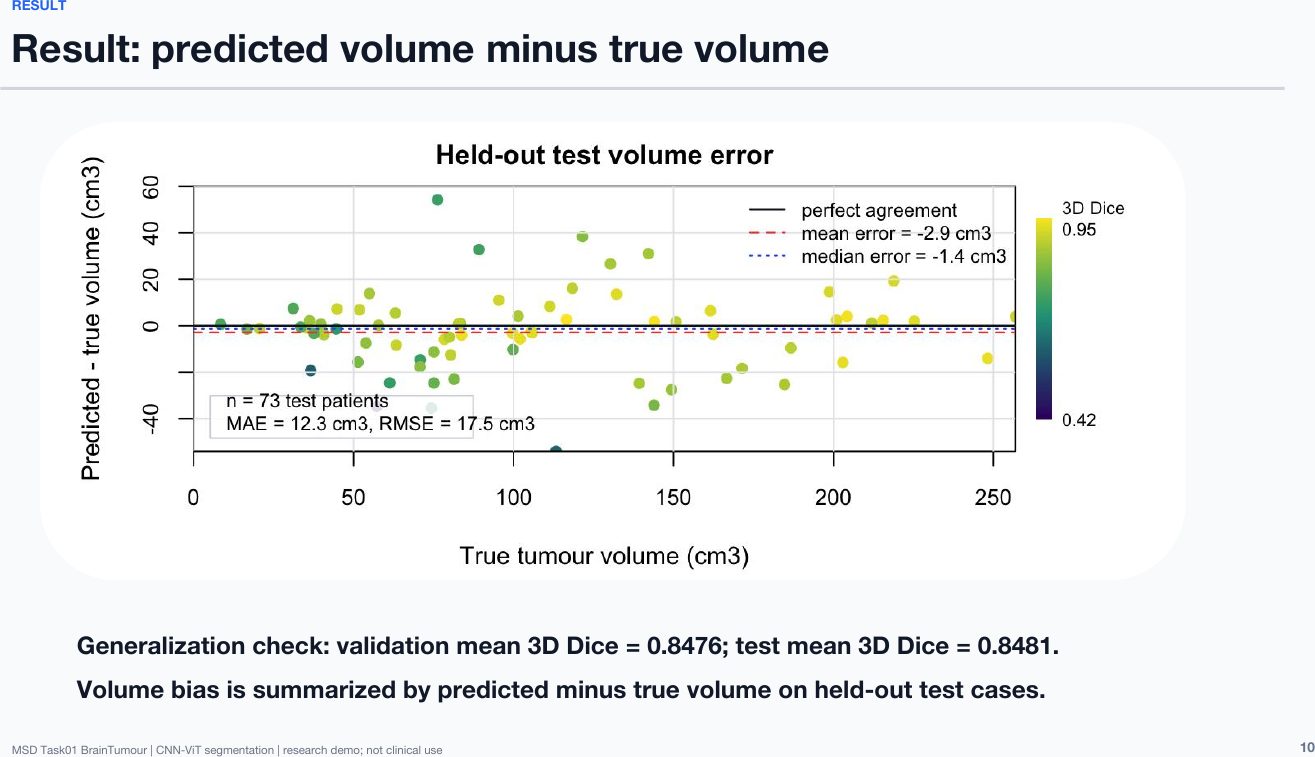
| Pretrained CNN–ViT | Held-out test (73) | 0.848 | 8.7% |
| Four-label variant | Held-out test, whole tumor | 0.845 | 8.9% |
4What this does not show
- It is a research demo, not a clinical tool.
- All results come from a public research dataset (Medical Segmentation Decathlon) and have not been clinically validated.
- Sub-region outlines are not yet reliable; volume should be read from the whole-tumor result.
5Selected slides
6What this work shows the team can do
Researcher in Medical Imaging and Machine Learning
Senior Imaging Scientist at Novartis. MIT PhD in ultrasound imaging and medical robotics. Co-founded two medical startups.
The team ran the experiments and built the model and the web tool. The Project Lead met with the team weekly and provided a starting transformer script.
Medical imaging · AI · Biomedical engineering
A working tool reviewers can understand at a glance makes a strong portfolio piece.
References
- Antonelli, M. et al. (2022). The Medical Segmentation Decathlon. Nature Communications, 13, 4128.
- Dosovitskiy, A. et al. (2021). An Image Is Worth 16x16 Words: Transformers for Image Recognition at Scale. ICLR 2021.
- Dice, L. R. (1945). Measures of the Amount of Ecologic Association Between Species. Ecology, 26(3), 297–302.
Join the AI and Computer Vision in BioTech – Novo Nordisk Project
This outcome came out of this project. Work with a medical-imaging researcher on a real problem, and leave with something you can open and show.